 Study
for Masking dead chips/channels
Study
for Masking dead chips/channels
- The current DB of bad chips , channels (from 2014/02/09) based on 3 sigma deviation of average of all time bins from mean of time bin2.
- The new conditions for mark Chips as bad : (average and sigma are after excluding the anomalies )
- CM mode noise cut = 5adc< CMnoise <16adc (ladder_x)
- Pedestal noise cut = 10 < PDnoise < 60 adc
- Pedestal cut = PD_average - 5*sigma <PD<Average + 5sigma (ladder_x)
- Included in DB, if chip/channel marked bad more than 90% runs
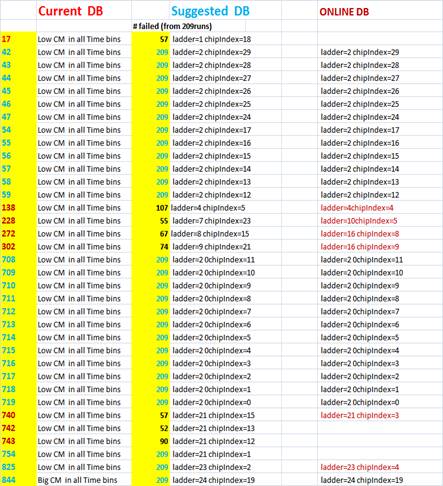
- Table in right shows the current DB in left (ChipID included both in blue and red) and suggested DB is in the same column but only blue. The chips ID marked with red are the chips that are not in new DB.
- New DB based on 209 runs in blue and rate of marked as bad chip and reason. The current DB of bad chips showed in red for comparison. The difference between two DB appears to be only due to rate of failure.
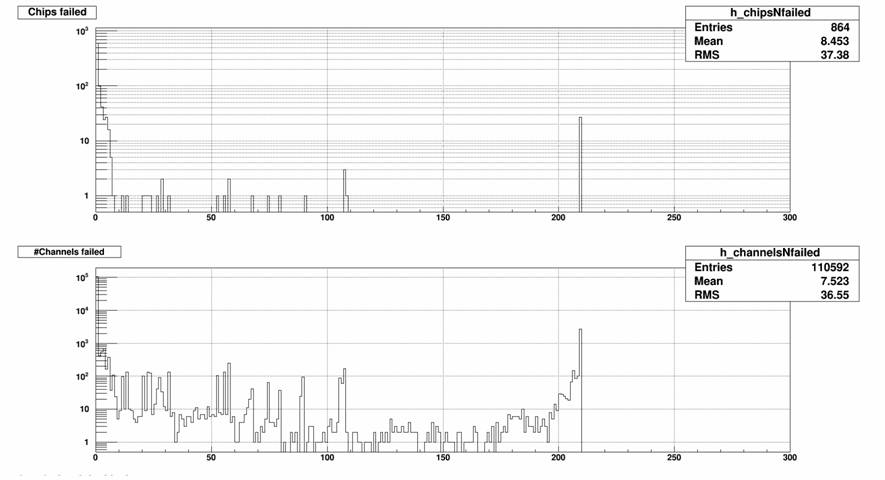
- The list of all chip that failed at least one time is here.
- List bad channels:listbadchannelsTB2.C
- code 0001 failed due low PDnoise
- code 0010 failed due High PDnoise
- code 0100 failed due low PD
- code 1000 failed due high PD
- List Bad Chips : Badchips-TB2-cut90-04.02.2014.csv (included RDO/ARM/Group)
- List chips failed at least 1 time : BadchipsTB2-MIN-1-04.02.2014.csv(included RDO/ARM/Group)
- List chips failed at least 90% of fraction of runs : Badchannels-TB2-cut90-04.02.2014.csv(included RDO/ARM/Group)
- List chips failed at least 50% of fraction of runs : Badchannels-TB2-Cut50-04.02.2014.csv(included RDO/ARM/Group)
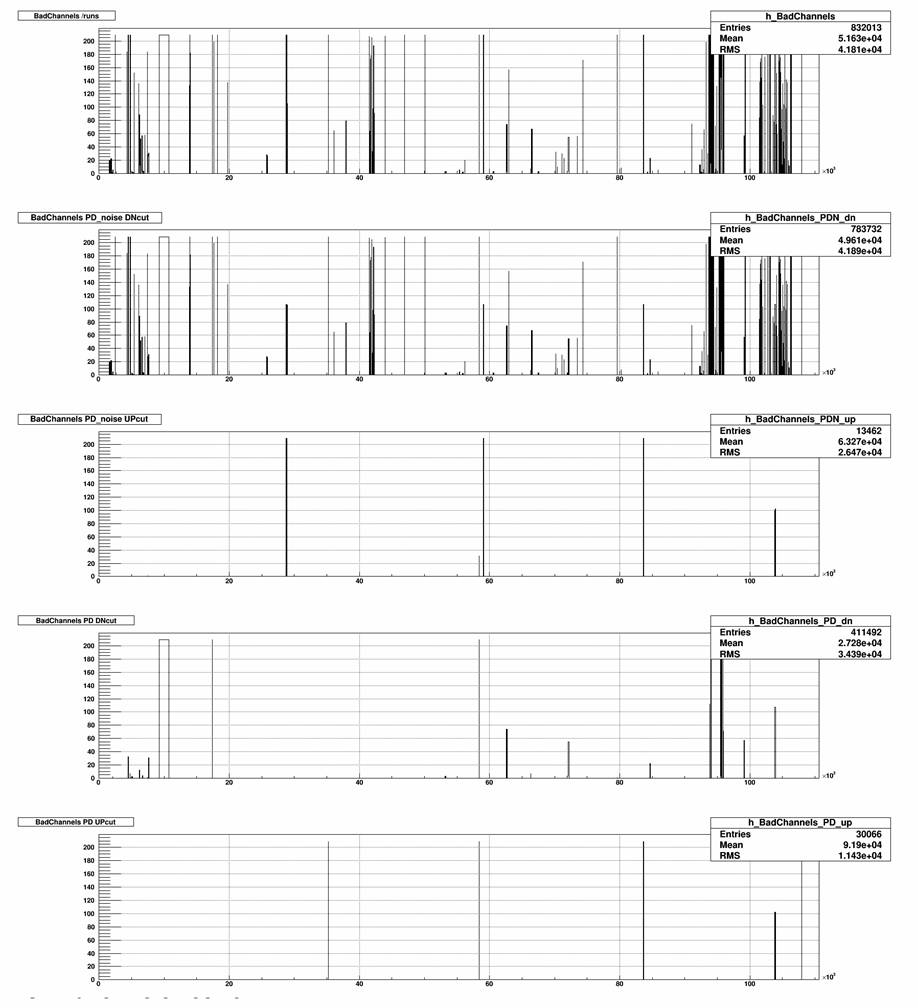
Following plots show distribution of Channels marked as bad vs Runs and divided to 5 categories :
1- Bad Channels failed for all conditions
2- Bad Channels failed for PD_noise<10adc
3- Bad Channels failed for PD_noise>60adc
4- Bad Channels failed for PD<PD_average - 5*sigma
5- Bad Channels failed for PD>PD_average + 5*sigma
Following plots show distribution of Chips marked as bad vs Runs and divided to 3 categories :
1- Bad Chips failed for all conditions
2- Bad Channels failed for CM_noise<5adc
3- Bad Channels failed for CM_noise>16adc
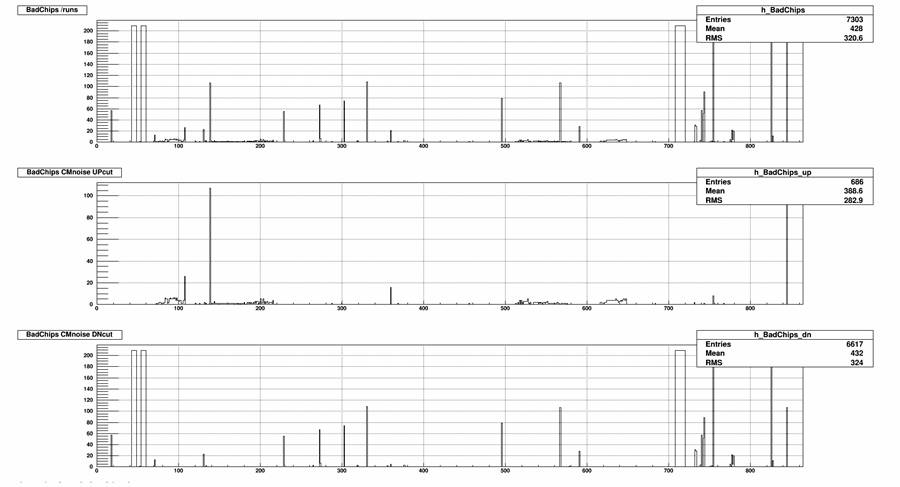
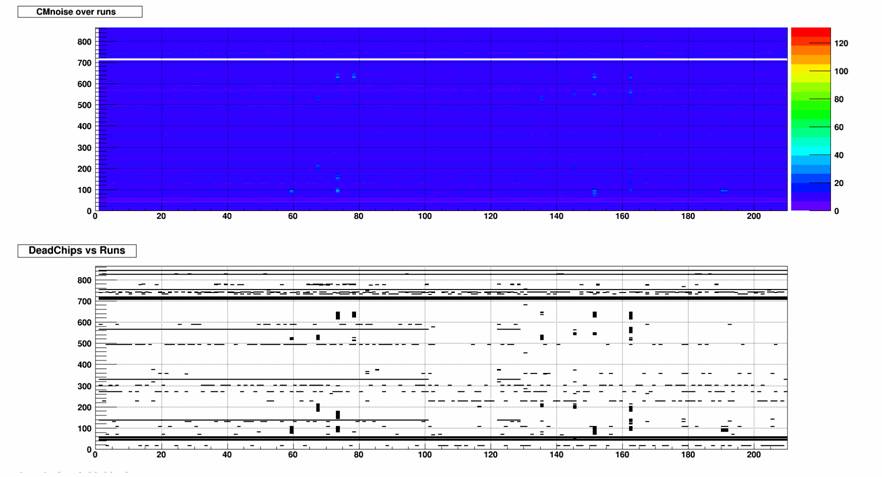
Following plots show distribution of Chips’ CMnoise and Chips marked Bad vs Runs (209 runs)
Following plots show distribution RATE of Chips marked Bad (209 runs)