If there were some physical mismatch in the readout subsytems, the tower and preshower channel numbers will not be correlated to a hit
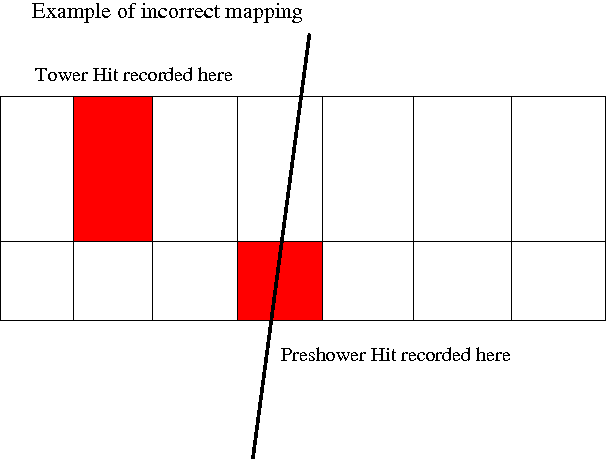
If the channel number of the preshower and the tower are the same, and the preshower has a signal above pedestal but the tower has a signal below pedestal, record this hit
This was the simpler of the two tests, as the root file already arranged identical preshower and tower channel numbers on the same row. The tower pedestal width was estimated as 2 sigma from some test plots, for the preshower it was 3.5 as used before. The pedestal cuts are not too sensitive to width due to the discreet nature of the ADC
Even though events like this will occur via other processes they should be randomly distributed over all the channels. If there is a mismatch in the channel readout we hope to see a spike because the tower channel will be empty more often than normal for a bad channel
From the following diagram we aim to detect the following "bad mapping" by a statistical anomaly in the distribution.
In this plot, towers with pedestal stat. bit not equal to 1 have been cut, as have preshowers with bad pedestal fits.
The bad preshower pedestals were removed by a cut of RMS >2.5, <0 and Mean>250, <100 from a fit to the preshower pedestals (see Pedestal fitting )
This plot is from the full data sample of about 140M entries
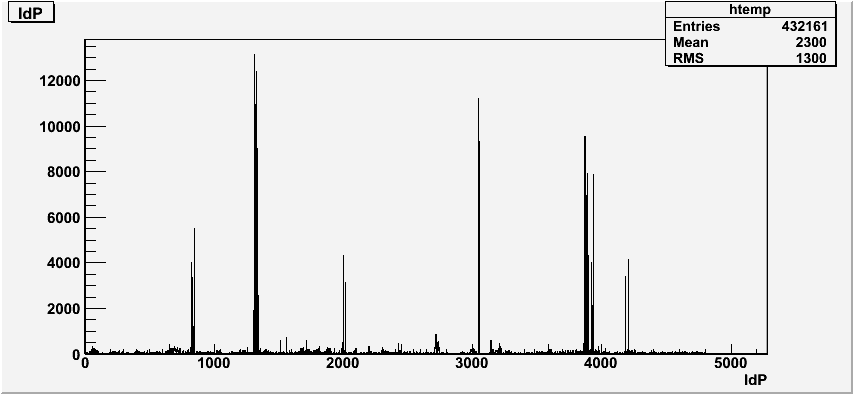
The spikes were defined as having more than 500 events recorded in a channel
Channels with more than 500 events for this histogram are shown in the following list,
Channel Id, events in that channel
This test is a bit more involved but follows on from the first idea. In the first test we hoped to find a mismach where the tower channel was empty with the same preshower channel hit. Here we hope to find the missing hit, by scanning all the tower channels in an event, bar the one with the same channel as the preshower.
All the hits with preshower (3.5 sigma) and tower (now 3.5 sigma) above pedestal were recorded in a event. Then, within an event, the preshower channels were compared to each tower channel except for preshower Id == Tower Id
The combiantions per. event from this comparison rapidly fill the output, the following plot was made using about the first 800000 events from the total sample
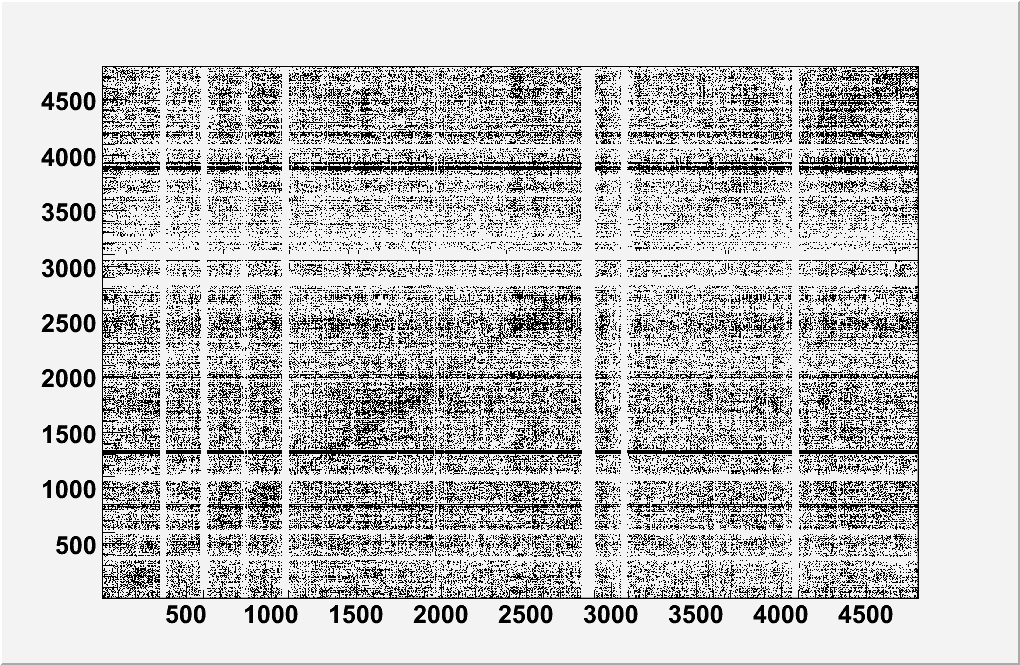
The white bands are missing channels from the selection
It was expected that "patches" may be seen if there were a bad mapping but the background seems too high to see anything. None are clearly visable with this plot
In this plot, cells with less than 10 entries have been removed and colour indexed, no grouping was seen in this plot either.
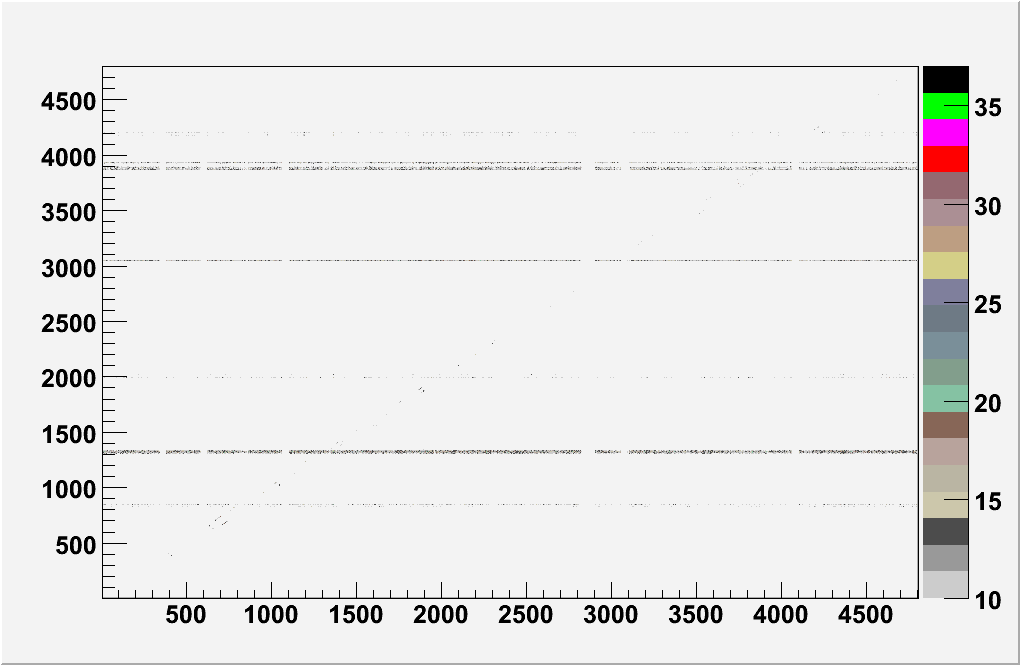
One interesting point is that a band can be seen along the x=y axis. As the events preshower == tower were excluded, this band may be a result of tracks from one towers preshower passing through the neighbouring tower
As a final investigation, the preshower channel for a big peak from the first test, 1329, was plotted over all the towers
Towers with preshower 1329 in the second test
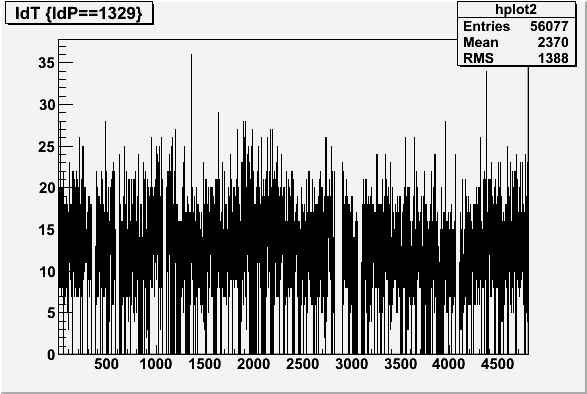
Nothing indicates a mapping problem here, indeed, looking at the raw adc value for this tower shows it is one of the "Spiked" channels seen in the pedestal fitting (see link for this plot)
Example of this channel with spikes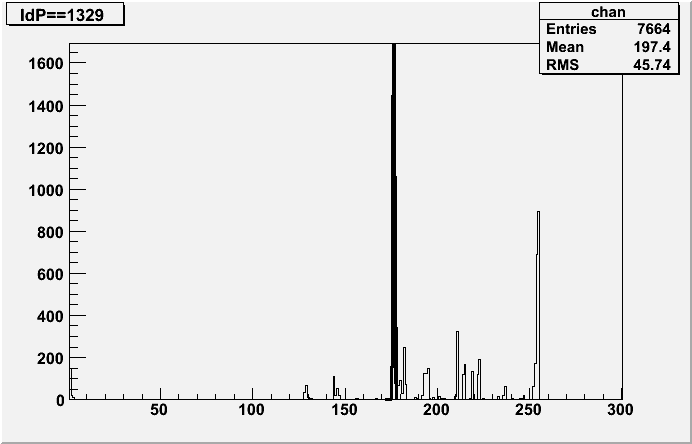