This is an update of the Upsilon analysis being carried out by the Texas A&M group, Rory Clarke, Matthew Cervantes and Saskia Mioduszewski. We have been looking at several interesting features of the Upsilon data that has come from the mixing, including the online pedestals, online status, trigger emulations and the preshower
We have processed about 5 million Upsilon events
These events have been paired
These events have used all the vertices's within +/-40cm along the Y axis
PID cuts:
dEdx 3-5, this wider cut is for the Preshower, 3.4-4.8 is the nominal value used in PID
E > 1, p > 1, 2 and 3
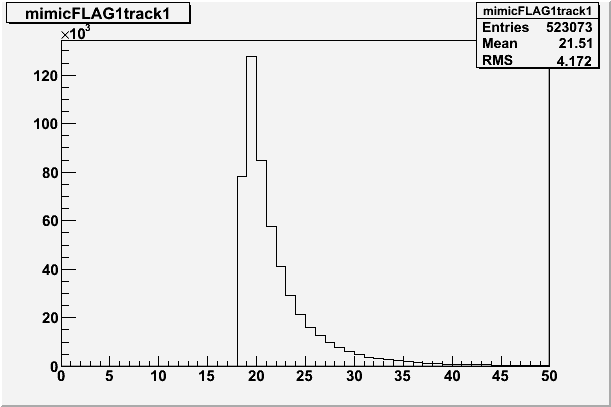
The L2 Result Array triggered data used the online pedestals during the run. If we select tracks with the same L0/L2 towers used by trigger, per event, the bitshifted ADC value should show a sharp cutoff if the trigger selection method is correct as these tracks will be above the trigger threshold. We used various combination from the information available with the following results:
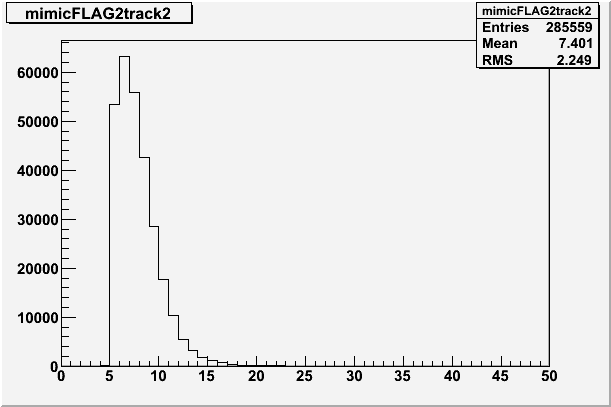
It is interesting to note two points,
First, neither pedestal show a "clean" cut, it seems as if there is some rounding error.
Second, the best selection function is different for the L0 and L2 case.
Finally, these triggered track selections, “mimic triggers” will be used in the rest of the analysis
As described above, the trigger can be "mimicked" on the offline data by re-analysing the BEMC ADC values in the tracked data. This will allow us to analyse how the trigger matches to the tracked data. We have the L0 and L2 online towers stored in the L2 results array. Next we examine some of results from these selections on the paired dataset
The online trigger looked for a tower passing the L0 threshold and then scanned the rest of the BEMC for any tower that passed the L2 threshold. If this was the case, and the two towers were separated by greater then 60 degrees, the complete set of tracks in the event were read out. We pick these pairs in the offline data in the same way using the L2ResultsArray.
Did any track match the L0 tower for this event
If yes, Did any track match the L1 tower
Pair together 1 and 2
The online L2 trigger could have more trigger candidates pairs in an event and this was the reason we studied the "mimic" trigger. We examine the paired data and treat each set of tracks as a possible L2 trigger on a pair by pair basis
We pair tracks in such a way to avoid double counting
Did one track of the pair satisfy the L0 trigger condition
Did the other satisfy the L2 trigger condition
select this pair for analysis if the angle is greater than 60 degrees
One sideline of this investigation was the use of the online status for the triggered towers. Some towers were masked by the trigger during the run. Adding this information had little effect on the outcome.
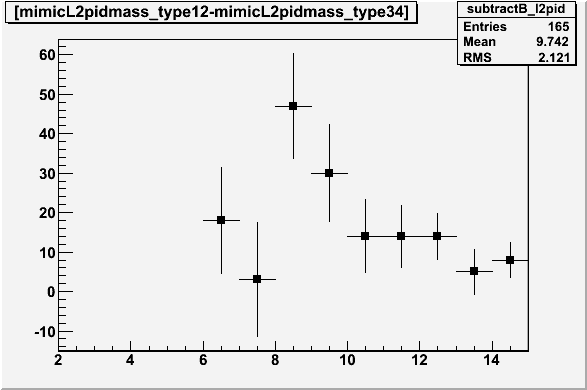
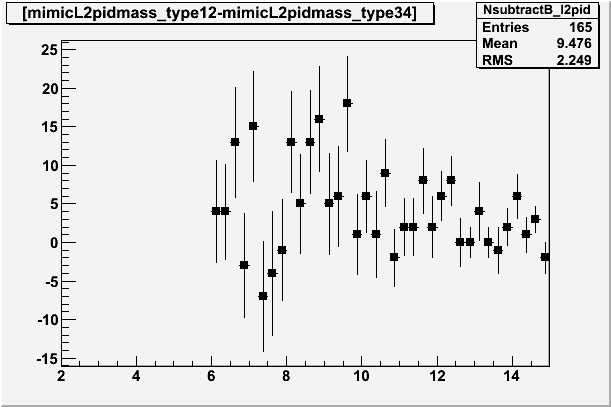
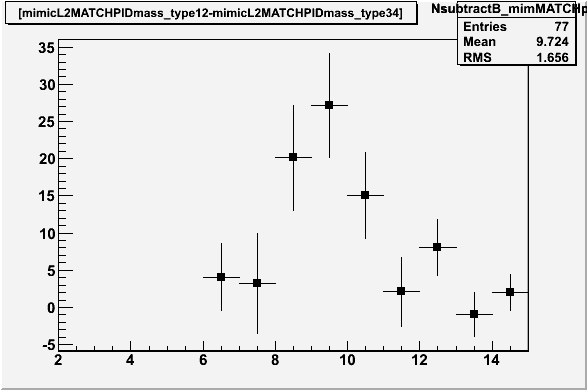
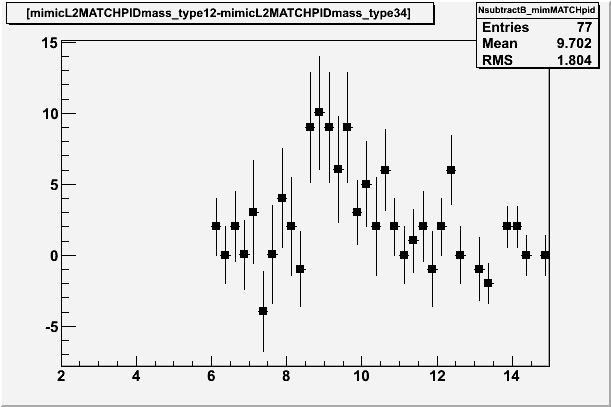
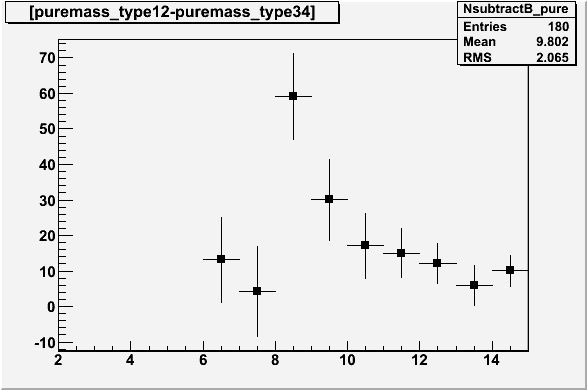
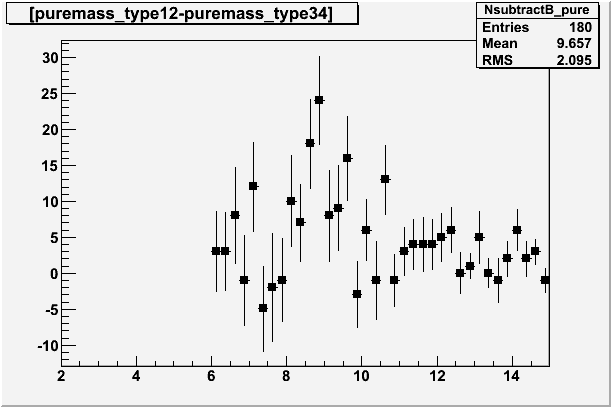
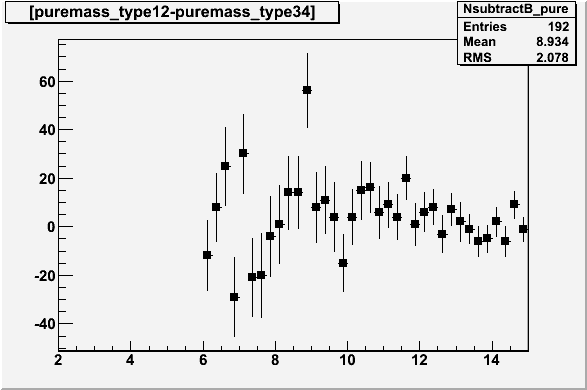
We see the interesting effect of the L2 result array seems to be a reduction of some sort of background under the peak. In the mimic and even the full mass plot (see below), the peak could seem to be sitting on a pedestal of around ten events, for example the three bins for 8-10 Gev are about 90 Gev in the Mimic above but drop to around 65 in the lower plot, this is about a 35/3=10GeV pedestal. The L2/mimic combination seems to remove this "pedestal". Also the peak shifts to the right by one GeV from 8.5 to 9.5 GeV.
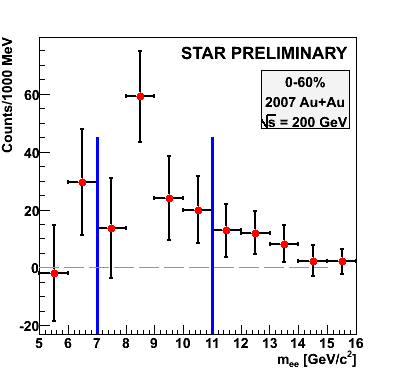
For comparison our current peak with PID and P>3 is plotted with the QM peak
One thing that strikes you with these plots is the negative dip at 7.5 and 10GeV
The online pedestals have been used
We have compared the results from mimicking the trigger conditions to the L2 Results Array
The online status from the triggers dynamic tower masking was used, it did not seem to have a great effect
The "mimic" trigger seems to be sitting on a pedestal that the L2 Results Array and mimic combined remove.
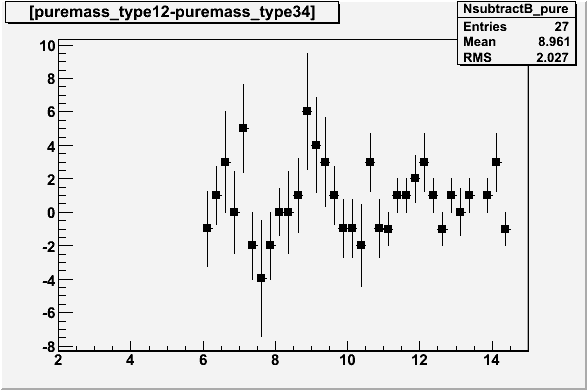
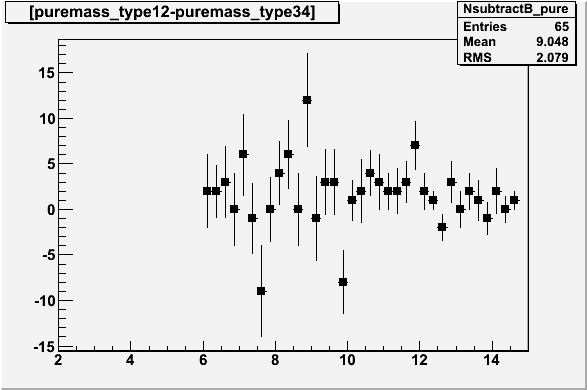
The preshower has been compared to the current mass peaks and at 250GeV per bin, suggests some structure at 7.5 and 10 GeV and a peak at 9.5 GeV
The statistics are reduced by the preshower and the peak is very narrow. The background, apart form two points, seems to tend to zero
The background is questionable, maybe this could be improved by mixing the background over several events instead of within the same event. We have an idea for how to do this that we could investigate at A&M