This is an update for the callibrations I am making on the preshower.
The preshower swaps are in this analysis but I can not seem to get them in when I read the Upsilon MuDst files. I am doing one of two things wrong:
1) The swaps are added at production and I am adding them again during my offline analysis, maybe do I have the right flag on the ADC to E maker that includes them
2)I have not set the ADC to E maker right and am picking up unswapped data
To I have added them with a hard fix to the code for this analysis and THEY ARE IN but would like to get this right for the future as it is messy, here is a copy of my Maker chain I read the MuDst production files with so if anyone can spot something...
StEmcADCtoEMaker *adc = new StEmcADCtoEMaker();
//get control table so we can turn off BPRS zero-suppression and save hits from "bad" caps
controlADCtoE_st* control_table = adc->getControlTable();
control_table->CutOff[1] = -1;
control_table->CutOffType[1] = 0;
control_table->DeductPedestal[1] = 2;
..... some stuff ...
StMyMaker * rorymaker =new StMyMaker;
Maybe some of these setting will alter the swapping in the ADC to E maker?
These cuts produce an electon rich sample peaking around p/E = 1 for the 5 million Upsilon triggers
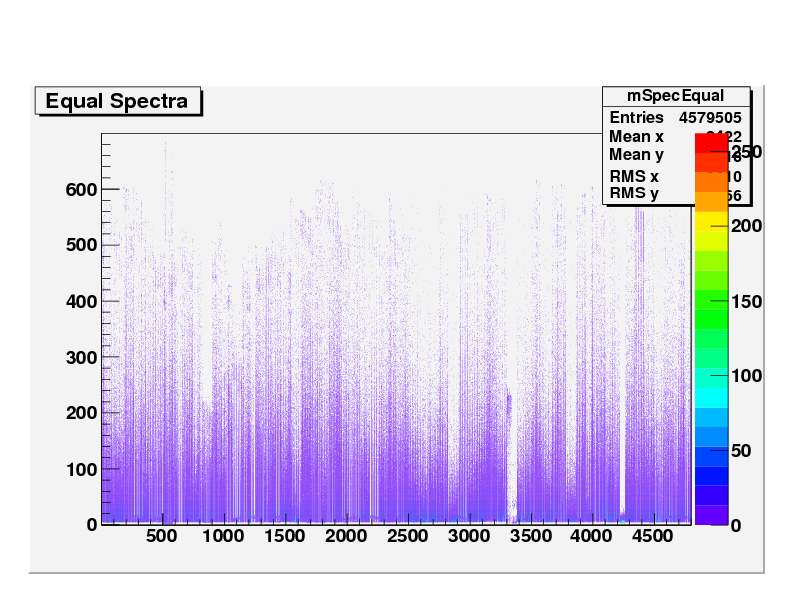
One strange point was that in the tower ADC vs. channel number plots, the trigger for the 2007 data can be seen, however it could not be seen in the preshower distributions
Here a trigger can be seen in the ADC data starting at around 280 for the towers
TOWERS:
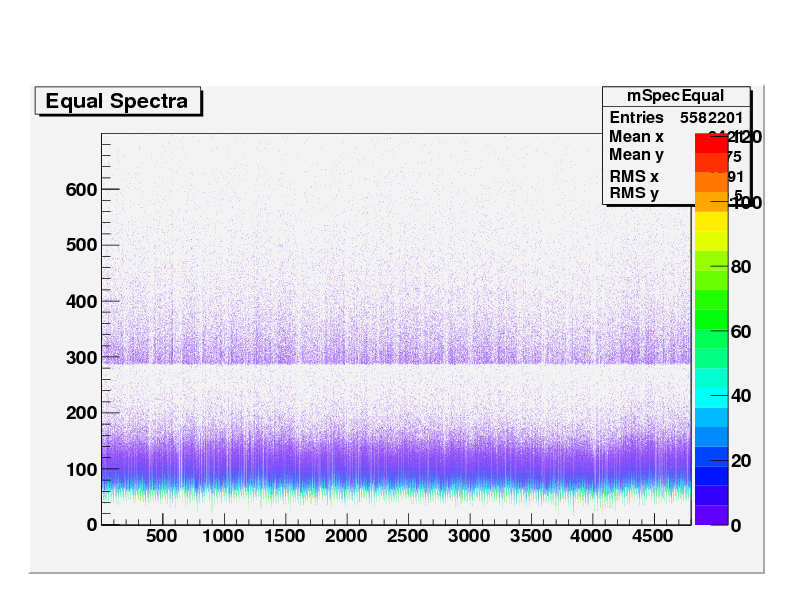
Here the trigger was not seen for the preshower
PRESHOWER:
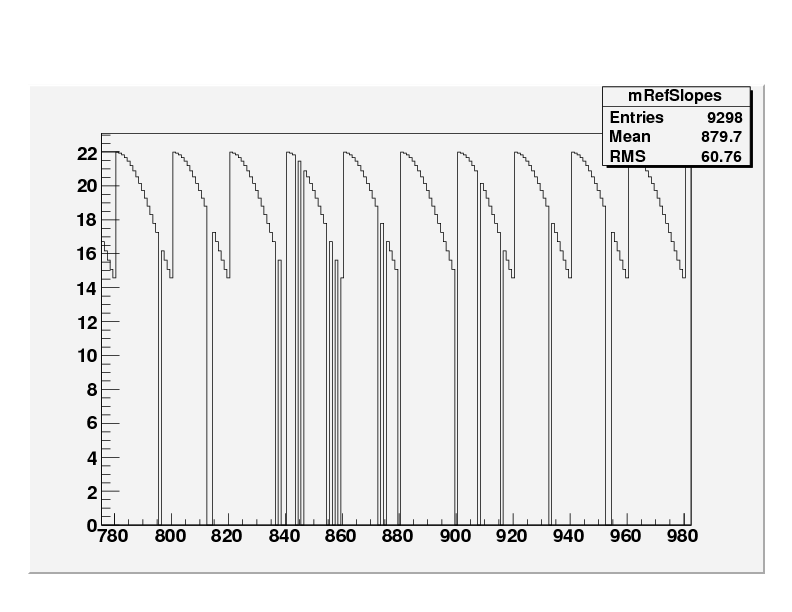
Method 1:Slope fitting
An exponential fit was made to each distribution in an "eta ring" and then these slopes were normalised to a test function of the form "22*Sin( eta )"Sin reference slope plot, removed hot towers seen as cuts and zoomed for clarity to SoftId range 780-980:
Method 2:Closest to average
For a ring in eta (numbered -20 to 20 for -1 < eta < 1) the average value in a range for each tower distribution was found. The tower with the closest to that average value was fitted with an exponential and the other towers were each fitted and normalised to this slope.
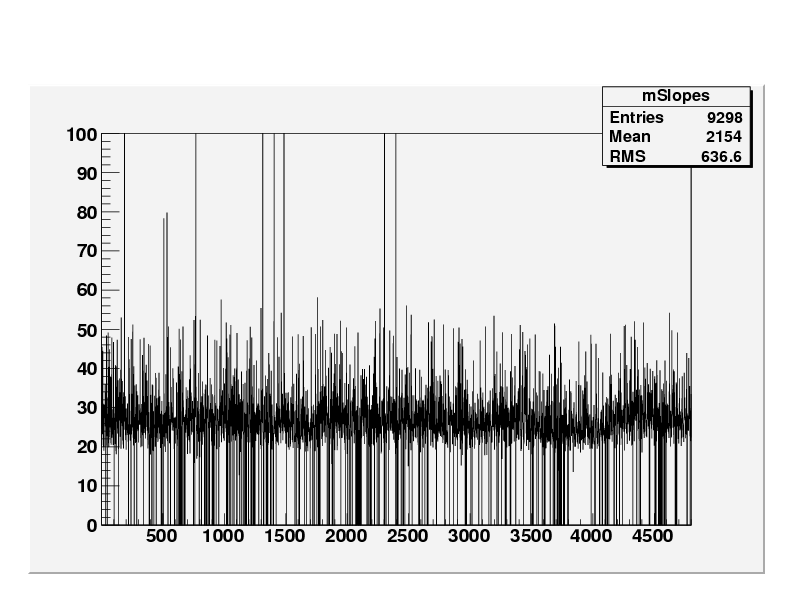
To test these methods the slopes for the towers were generated and compared, the tower slopes are in much better shape then the preshower and should be fairly flat. Also the two methods should give the roughly the same distribution if they are working, which seems to be the case.
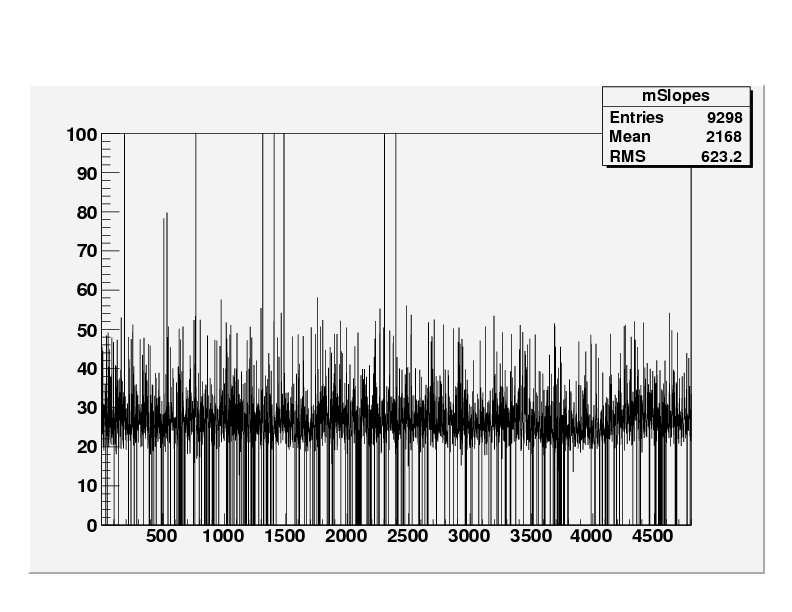
Tower slopes fit method 1:
Tower slopes fit method 2:
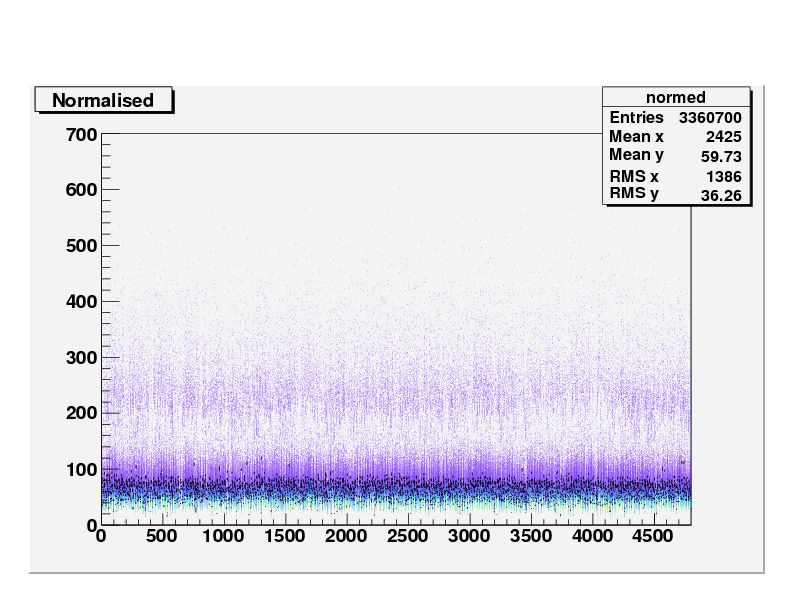
Normalsied and rebin Method 1
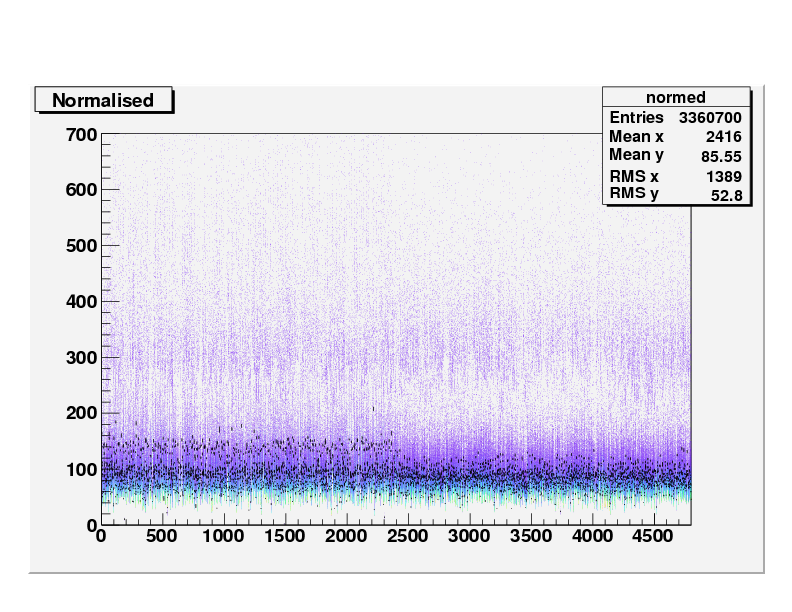
NOTE: the black points indicate the average per bin (Used ROOT ProfileX)
Normalsied and rebin Method 2
These seem to be in pretty good agreement so now we can use these methods to look for preshower gains. Method 1, the slope to function method work better
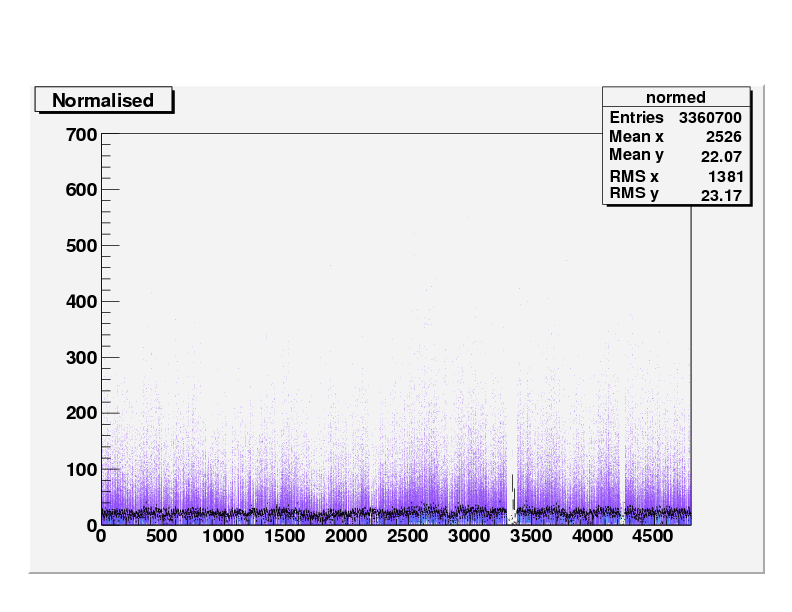
Raw, unnormalised spectra for preshower 4800 channels:
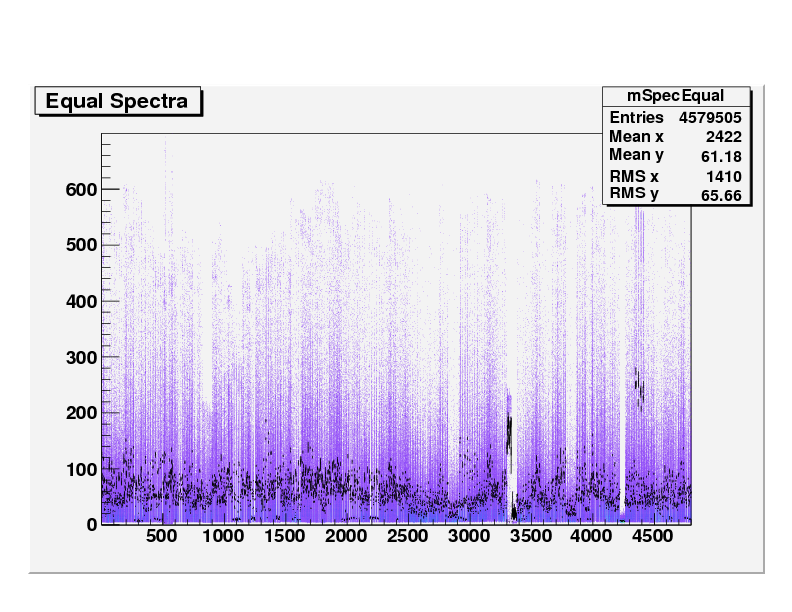
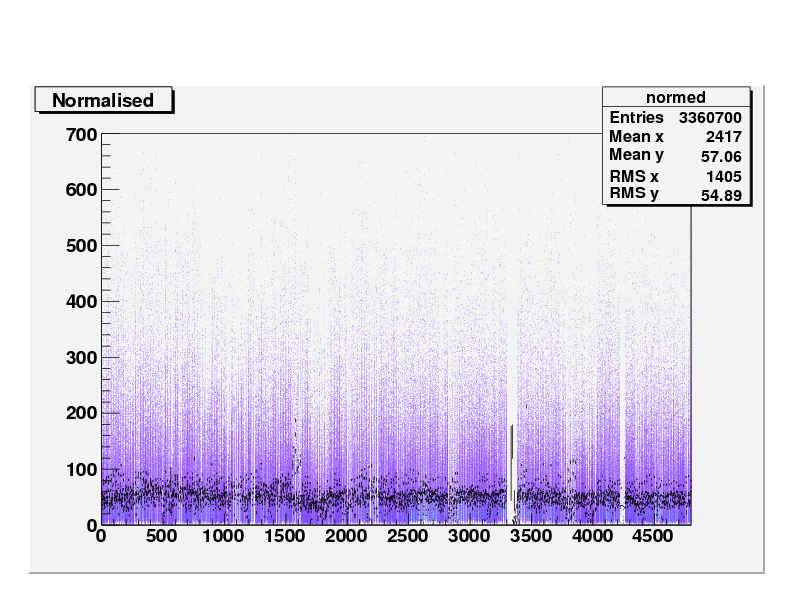
Normalsied and rebin relative method per ring (Method 1):
Normalsied and rebin slope to function of eta (Method 2):
This is a review of how hot tubes and towers were cut from the analysis using Method 1:
This was 797 of the 4800 channels, so we cut around %17 of the preshower
Method one, the slope function fit, works best and gives the tightest distribution
Find slopes over tubes instead of channels, I have a function I can add at this stage for this now from the swaps analysis.
Find MIP peaks for these channels with the gains applied