AGS Background and Systematic Studies
Fitting Mass Distributions
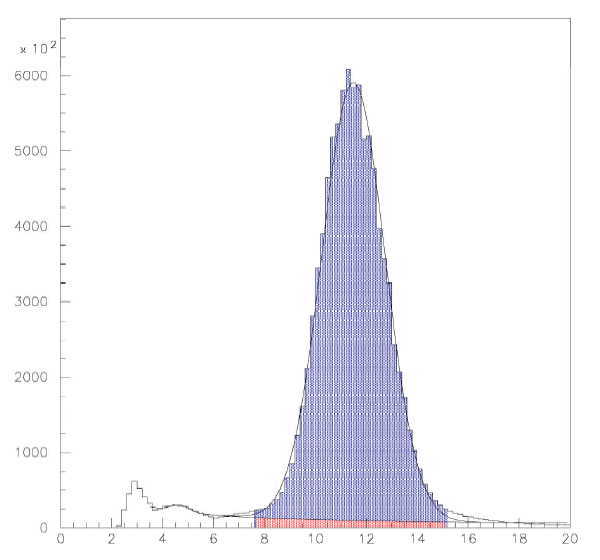
An example mass distribution is shown in the figure to the right.
The horizontal scale is in GeV/c2. The mass is fit with a function
of the form:
G1 + G2 + C1 + C2/x
where Gi represent Gaussian distributions and
Ci are constants. This is an 8 parameter fit
(3 from each Gaussian and the other two constants).
G1 is to fit the α peak near 4
GeV/c2. G2 is to fit the carbon peak near 11
GeV/c2. The background to the left of the α peak is not
fitted. This background is due to some unknown prompt signal and can mostly be
eliminated with a TDC cut
(see example here).
A cut to select carbon events is defined from the standard deviation
(σ) of G2. In the plot to the right, the data that
falls within a 3σ cut is highlighted in blue.
The background is defined to be the data under the function
G1 + C1 + C2/x. The portion of the
background that falls within the 3σ cut is shown in red on the plot.
Asymmetries are calculated for all data within the σ cut, data
with background subtracted and the background itself.
Asymmetries with σ Cuts
For all plots:
blue points are asymmetries from all
data
red points are asymmetries after
background subtraction
green points are background
asymmetries
black points are asymmetries with the standard "banana" cut
Format of data files defined here:
asymmetry data files
-t dependence data files
A different fit function (G1 + G2 + C1 +
C2/x + C3/x2) was used for Group 0 and
Group 1.
Group 0 Runs 1974-76,78,79,81-88;
Gγ = 46.5
3σ cut
asymmetry data file
-t dependence data file
Group 1 Runs 1872-79; Gγ = 41.5
3σ cut
asymmetry plot
data file
-t dependence plot
data file
Group 2 Runs 1897-1901; Gγ = 41.5;
cut TDC > 33
3σ cut
asymmetry plot
data file
-t dependence plot
data file
Group 3 Runs 1885-91; Gγ = 41.5
1σ cut
asymmetry plot
data file
-t dependence plot
data file
2σ cut
asymmetry plot
data file
-t dependence plot
data file
3σ cut
asymmetry plot
data file
-t dependence plot
data file
Group 4 Runs 1843-46,48-57; Gγ = 46.5
1σ cut
asymmetry plot
data file
-t dependence plot
data file
2σ cut
asymmetry plot
data file
-t dependence plot
data file
3σ cut
asymmetry plot
data file
-t dependence plot
data file
Group 5 Runs 1516-17; Gγ = 46.5;
Unpolarized
1σ cut
asymmetry plot
data file
-t dependence plot
data file
2σ cut
asymmetry plot
data file
-t dependence plot
data file
3σ cut
asymmetry plot
data file
-t dependence plot
data file
Comparison of 1σ, 2σ and 3σ cuts
residuals between
1σ, 2σ and 3σ cuts
maintained by: Jeff Wood, wood@physics.ucla.edu
last updated: 11/20/03