The goal of this analysis is to callibrate the pre-shower detector in the Barrel Calorimeter. This dataset used the Cu-Cu 2005 run with min. bias and hightower trigger, Production lib. P06ib
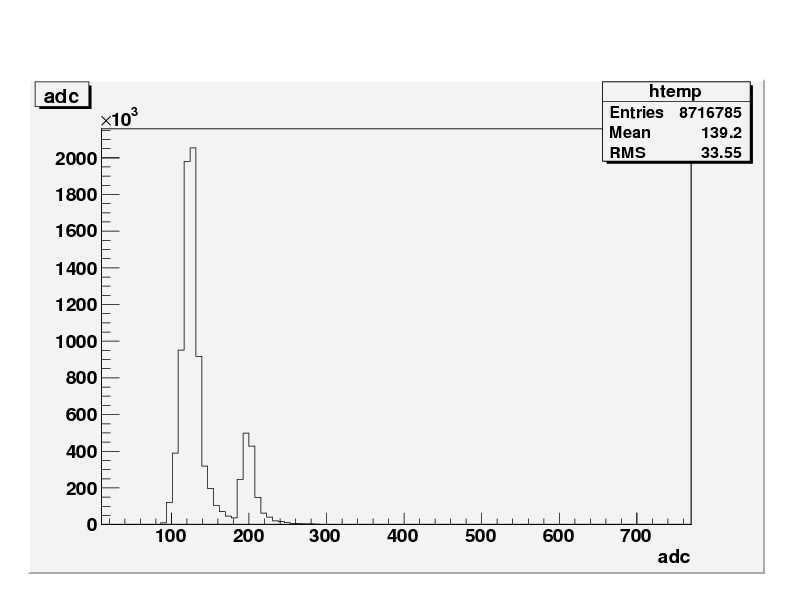
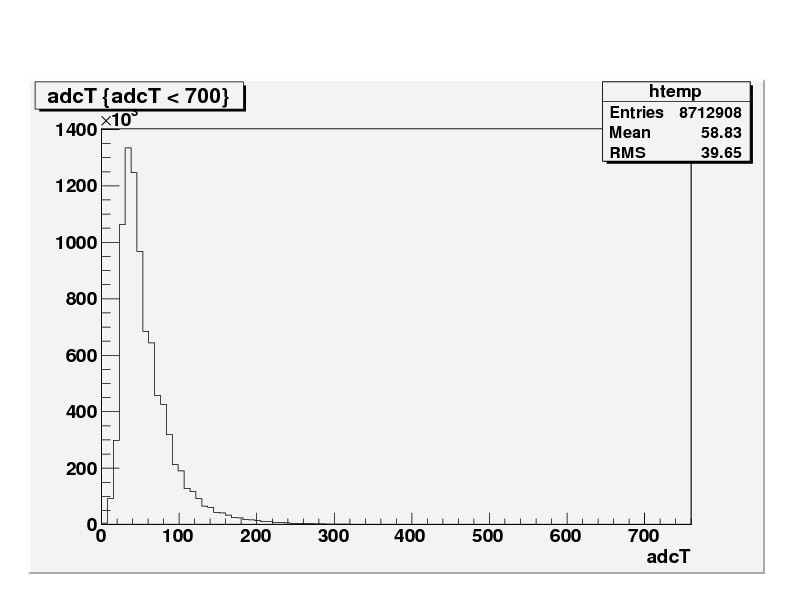
This plot still shows two peaks in the data with all the dat 48 data
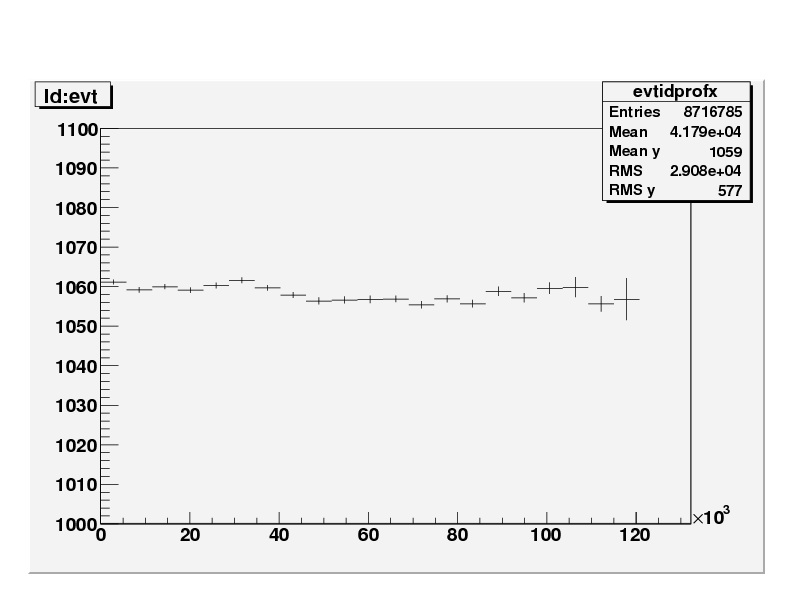
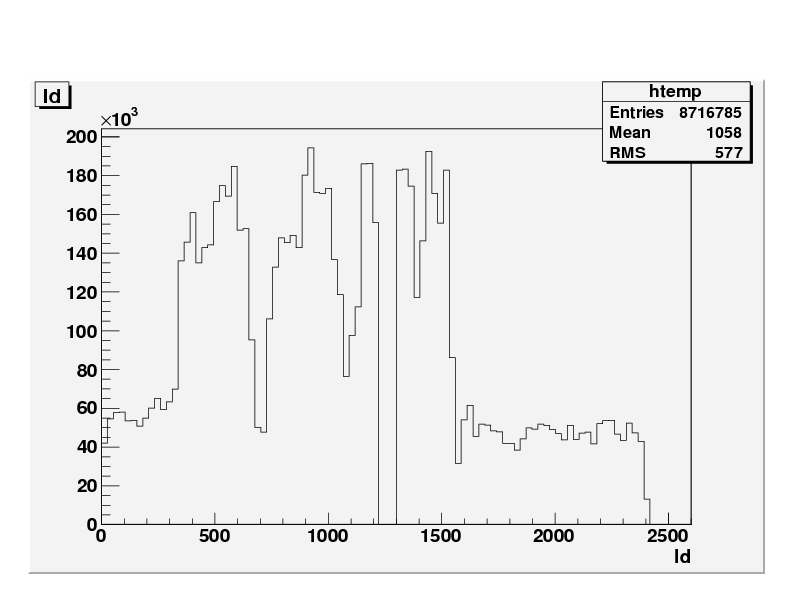
A non uniform distribution of hits is shown on the tower ID plot
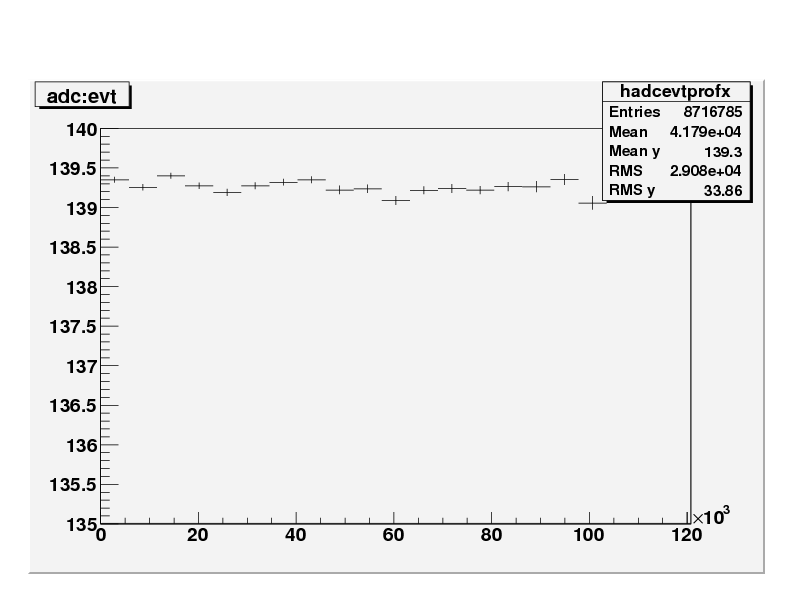
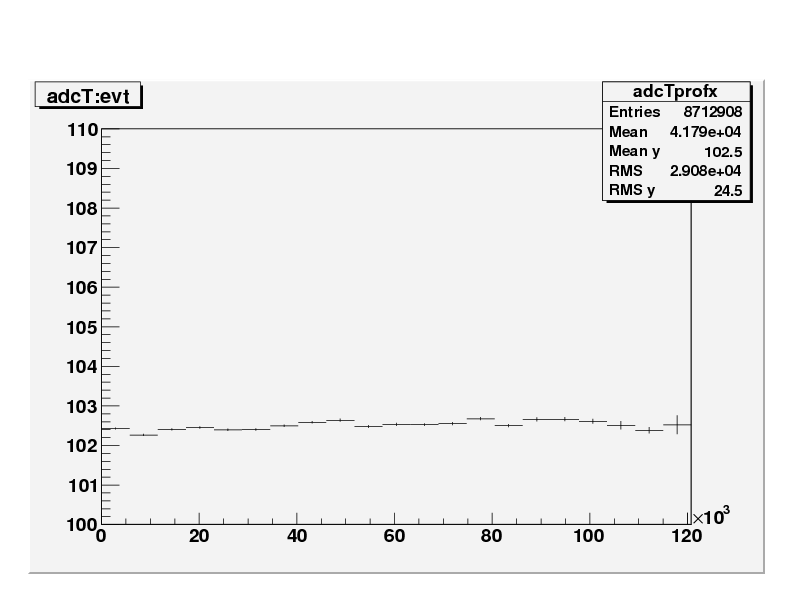
There was approx. 120,000 events in these data sets. This was binned as appox. 5700 events per bin and checked to see how stable the data was over this time period. These values seem to be stable