This is a list of the pedestal genereated from 1 hours worth of data from the Indiana files
I have analysed the runs from the Indiana files, the individual files are located here<
/star/institutions/iucf/qattan/prodAug8-06/
This is 7 runs worth of data. HOWEVER!! I use a cut off method for filling my histograms, after about 7000 events the histogram will stop filling, if it were to fill it would have 3 times the amount of events and slow the whole program down. I would say that I probably only use the first two of these runs in making my plots.
I thought that it may possible to extend this to find all the bad channels from this data and produce a preshower status table of sorts, but after reading Adams emails, it seems that the bad channels will vary over a run and this will be a much more involved task than the simple method I initally proposed
This is a description of all the information I currently have about these channels, please send me comments if you have any questions or suggestions
This is a list of the preshower channel, RMS Mean "return_bit" and "status_bit" from a Gaussian fit to the pedestal.
In the root file only:
The "Return_bit" is how well my fitting algorithem managed to fit to the data, it "Guesses" an inital mean and RMS from the distribution shape and uses this to constrain a Gaussian fit to the pedestal:
Also, there is a text file for these fits,
first col= chan
second col=mean
third col= rms
fouth col=return_val
fifth col=1 if good and not equal to one if bad return val
A text file with these fits is hereThe plots from these fits are divided into two sets for comparison with the pedestal databse
Adam and I both seem to find double pedestals, this could be a sign of pedestals drifting form run to run. Here is a list of all the bad channels that I found "by eye" looking through the plots
Note: This was done in two stages to see how it correlated with the database
Too wide:
3073 3074 3076 3077 3078 3079 3094 3096 3100
Ones with "Double peaks" Start at 3144 and seems to finish after 3022 A nice example of a clear double peak is 3049
Wide, with incorrect slope distribution
1975, 1974, 1956, 1955, 1954
Some have a sort of spiked distribution, there are a few! so I will give a range:
1306-1336 (1331 has a spike at zero) and 601, 612, 618, 620, 821 to 828, 832, 842, 843, 847, 848
Some have their distribution with an ADC value starting at zero,
379, 371, 821 to 857 and 1093, 1092, 1081, 1079
These distridution had the ADC value of the peak was too low with noise:
343, 344
Distribution SEEMS OK with stat_bit set not equal to 1 (some are wide but not too bad)
291,730,1337,1502,2821,3021,3743,3763,3781,3825
Peak at zero ADC:
369,370,378,582,555,587,600,602,604,606,608,617,823+Spikes,827+Spikes,837,841,859,1061,1062,1067,1073,1084,1091,1094,1097,1100
Spikes:
829,830,1302,1303,1304,1305,1308,1312,1325,1333
Wrong Distribution:
1959,1976-1980,3061,3069,3071,3072,3080,3082-3084,
3086,3087,3089,3091,3101,3102,3103,3104,3123,3124
Pedestal made up of narrow spikes
3872,3877,3879,3887,3890,3899,3900,3906,3907,3908,3910,
3915,3916,3925,3926,3930,3933,3934
The pedestal database status_bit did remove mostly bad channels at this stage. However, it did seem to catch a few good ones and to miss about 80 bad channels in the good data
Several different distributions were seen; Wide, Mean at Low adc and zero ADC, incorrect distribution, but the multiple "Spiked" distributions are most worrying. As they may mean a drifting pedestal, as mentioned in Adam's email, they will be hardest to trap, as we may need to review the pedestal run by run or fill by fill
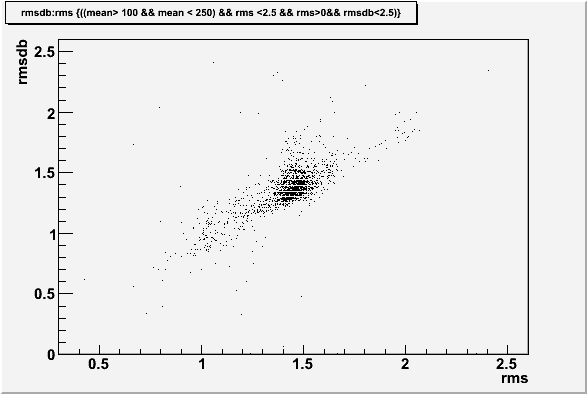
For this comparison a set of cuts were defined on the RMS and the Mean
With this cut applied to the database RMS values can be compared to the fitted values
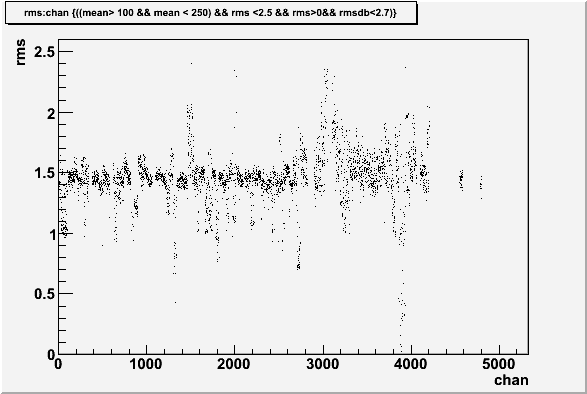
Rms fitted vs chan number
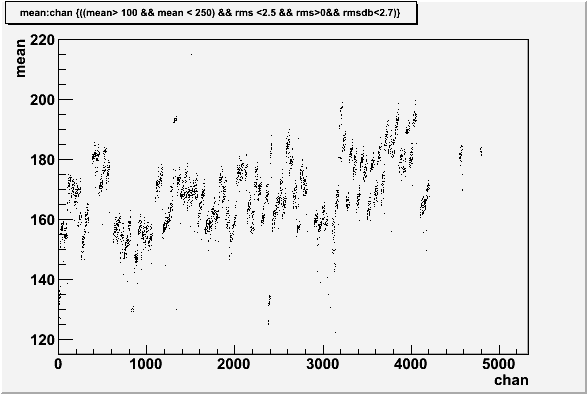
Mean fitted vs chan number
If we take the values that fall outside this cut, we can see how they relate to the type of bad distributions we found above by eye
As the sample is so large, I select a number of channels from each bad channel distribution at random and see how well it worked
Double peak 3049 not found
Spiked distributions, pt 1 see below:832 842
Wide distributions 3100,3078,3074
Wide, with incorrect slope distribution, 3100,3078,3074
Incorrect distributions 1955, 1974, 1973
Spiked Distributions, pt 2 see above: 828,618,620
Distributions at zero, 1081,857,379
Distributions that are low in ADC:343 344
"Good" distributions 1337, 3021,703
Multiple peaks around Gaussian pt1: 3890,3910,3934
Spiked pt1: 829
Multiple peaks around Gaussian pt2: 3872
Incorrect distributions 1959,3071,3104
Spiked Distributions, pt 2 see above: 1303,1325
Distributions at zero, 369,582,1062
The fitting and cut on the rms/mean seems to do a good job at finding channels with low ADC, bad or wide distributions
However, the forth type of bad channel, with "Spikes", this selection proves ineffective. The "Spikes" and the method of dealing with them need to be better understood for pedestal subtraction