http://www4.rcf.bnl.gov/~rfc/pp_anal/index.html
I then had some files from Adam, for PP data with tracking, and tried to match these to the generated pedestals. The result needs more work. There were effects that could have been due to pedestal drift (that are currently being investigated by Matt) and, of course, mapping effects.With the above caveats, I can show some plots for the MIP candidates. Avoiding anything that has been tagged with bad mapping, these plots show possible MIP candidates, with the condition there must be a second peak after the pedestal.
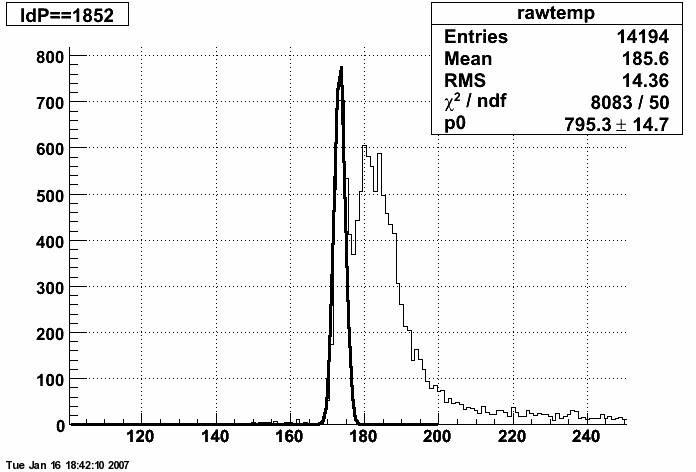
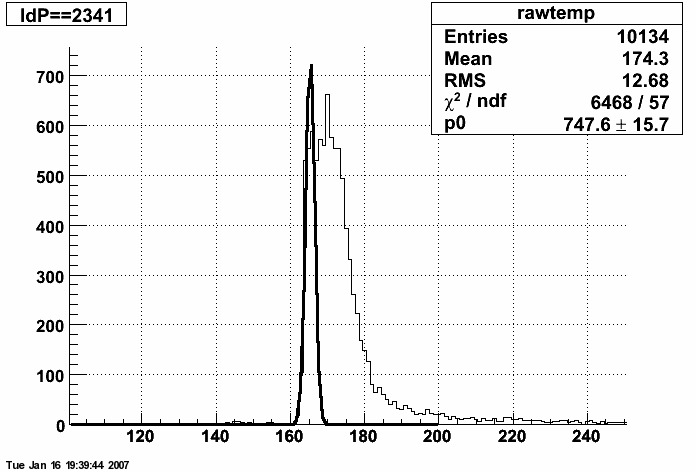
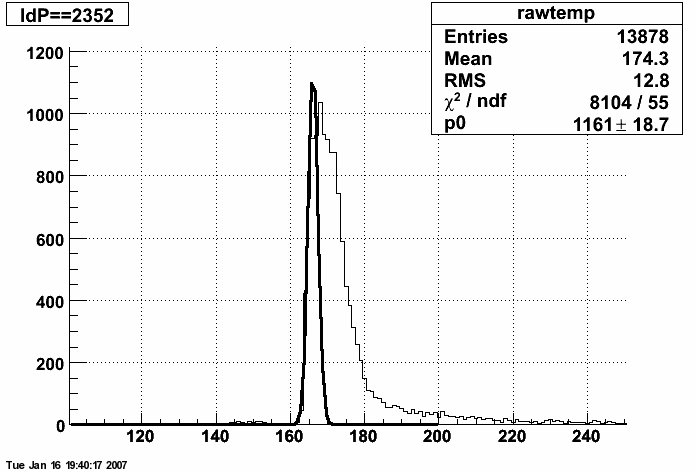
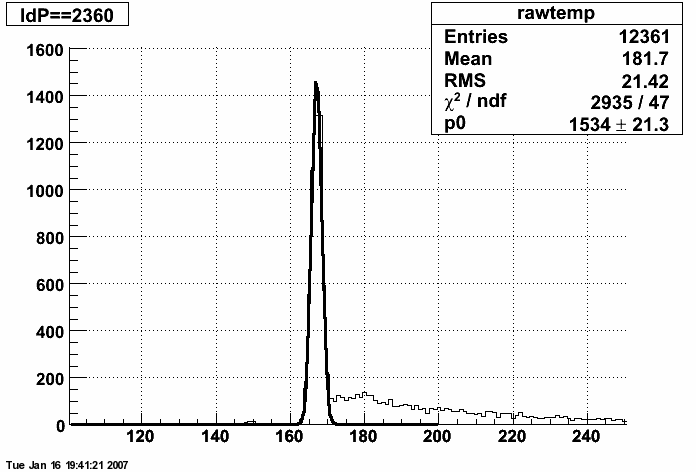
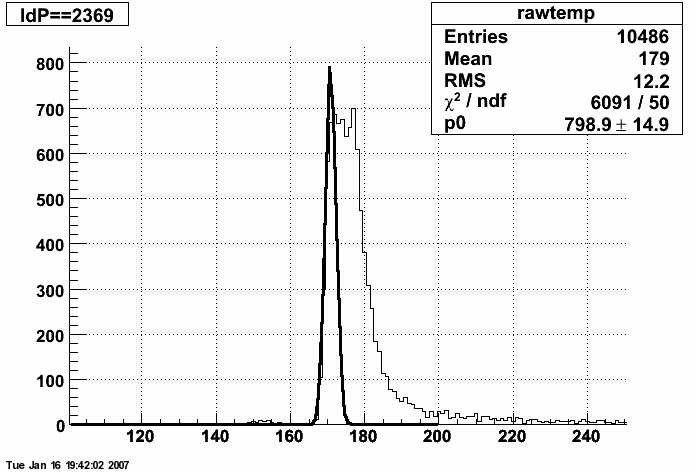
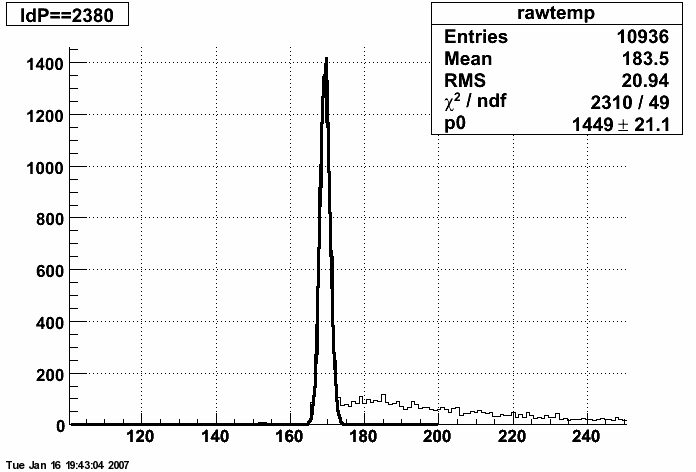
In these plots, the thick black line is the fit for the pedestal from the untracked data, the thin line is the data with tracking
These plots show the possible MIP peak has a huge width. This could be due to some sort of drift over runs maybe.
All plots here (including bad mapping etc)