Preliminary plots from CuCu data calibration, min bias
These plots come from the day 48 run. It seems that there are problems
with day 48 Pedestal Subtraction so these plots should be looked at
more as a proof of concept. Ahmed is currently updating the datasets
and the final calibrations will exclude day 48 data
The code scans all events and orders the datasets by tower
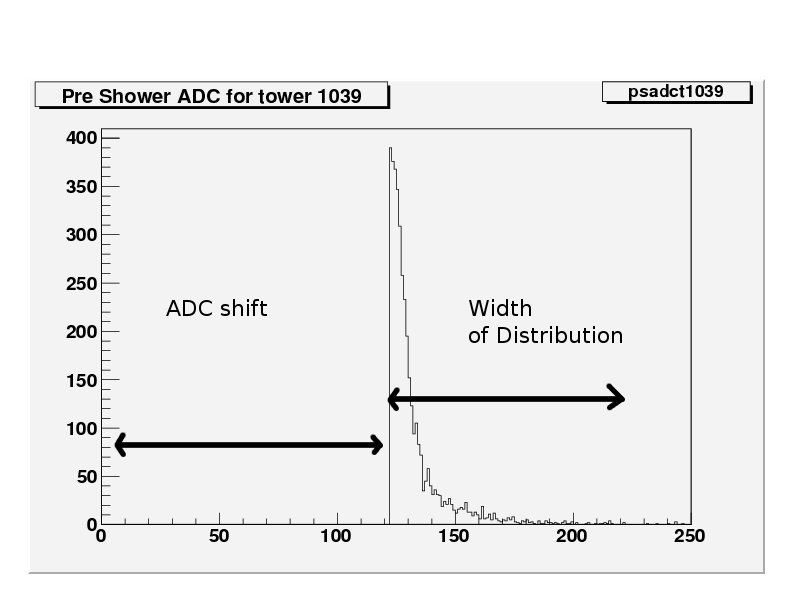
Example of preshower raw ADC values for tower 1039
Corrections
The above plot needs to be corrected for 2400 towers over a number of runs/days. The next step was to develop
a system that scans each tower to find:
The number of events per. tower
The range between the x-axis zero and the start of the distribution
(Dist Min)
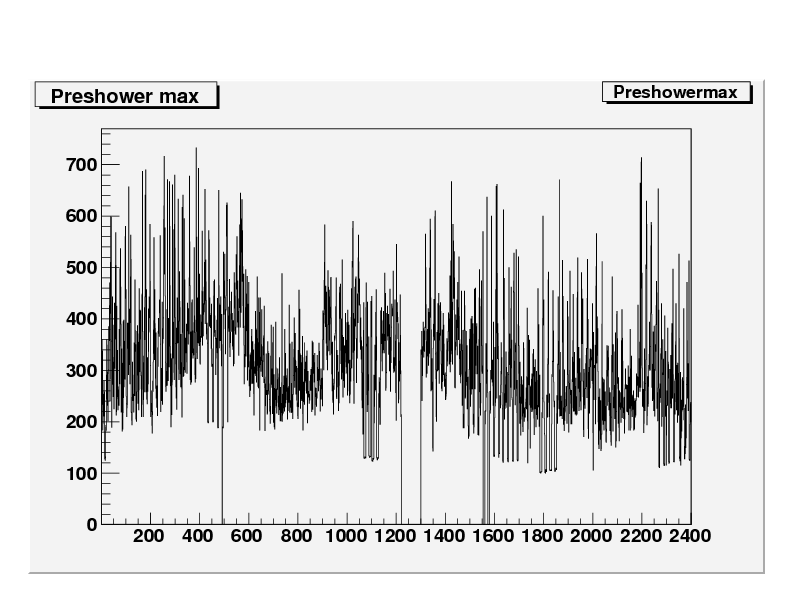
The Distribution maximum along the x-axis (Dist Max)
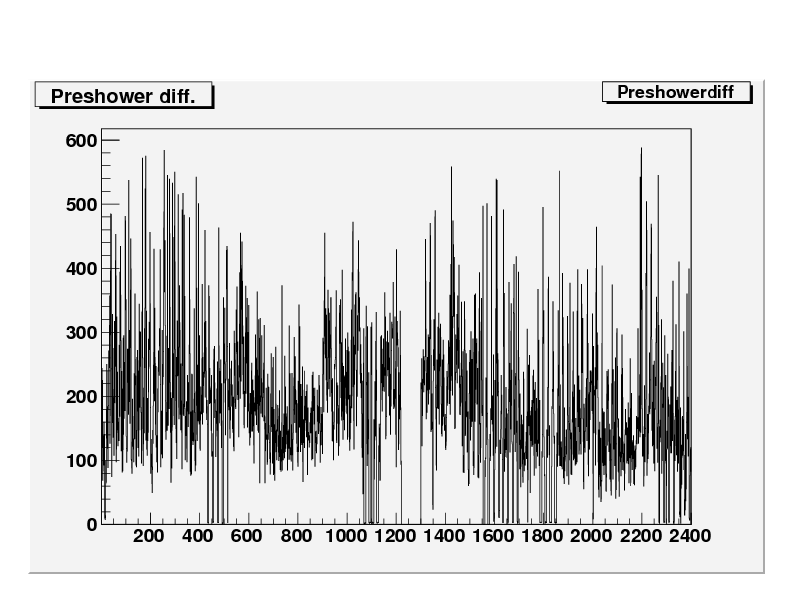
Width plot of Distribution for the pre-shower (Dist Max -Dist Min)
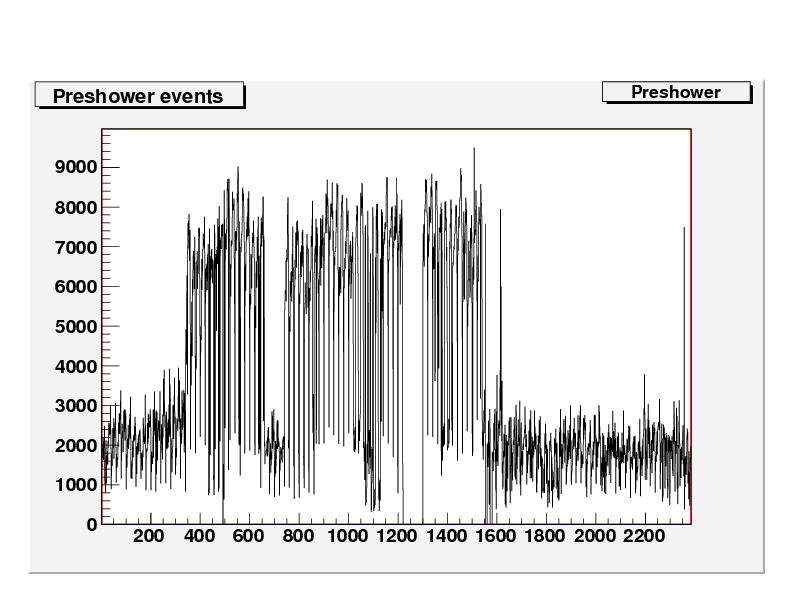
Preshower events vs. Tower Number
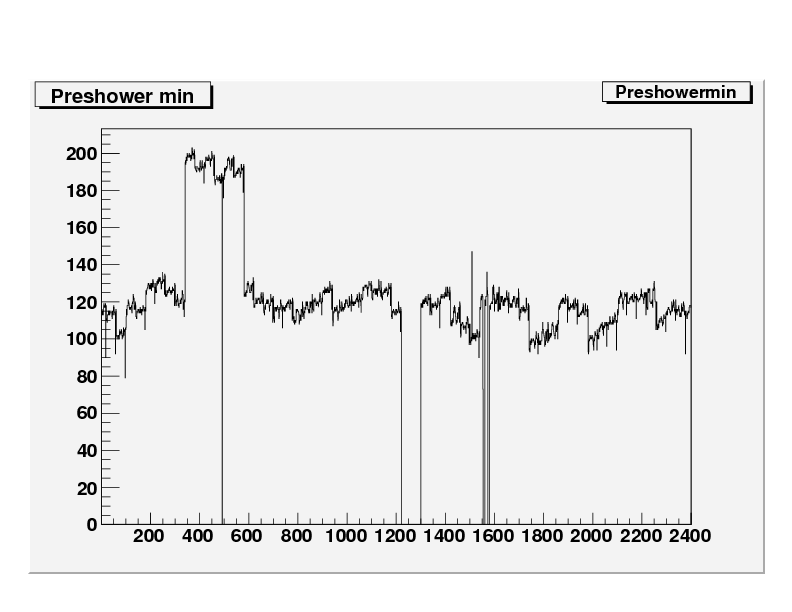
Preshower Min vs. Tower Number
Preshower Max vs. Tower Number
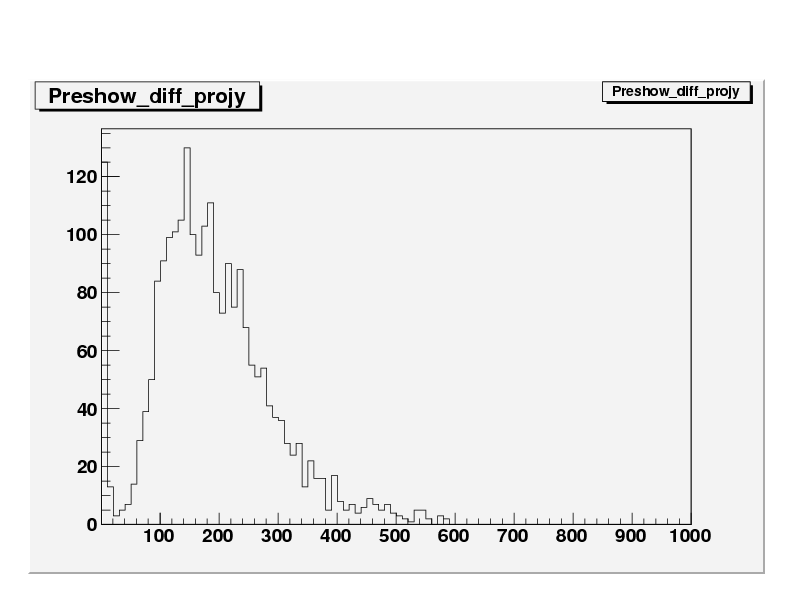
Preshower Diff vs. Tower Number
Current stage
The Dist Min, Max and events per tower will be used to find the optimum
ranges for fitting a Half Gaussian + Tail, around 100-500 to the preshower and tower
ADC distribution and correcting the ADC value.
Currently the code is being developed to only fit towers within this range of Dist Max -Dist Min and shifting the distribution to start
at zero using values of Dist Min. Only a small fraction of events are lost that will be considered safe. Outside
these ranges we will have to investigate why these towers are sitting
so far from the norm.