These plots come from the day 49 run. The pedestals values come from the database made during the "Pedestal Runs". This gives a mean and rms value per tower preshower:
Pedestal database for pre.Shower 2005-02-19 10:16:47Day 49 has two entries and this analysis comes from the later timestamp for that day.
We will apply the rms cut in the same manner as used in the StEMCADCtoEMaker code but in the following plots we wish to investigate the accuracy of the pedestal databse mean when compared to the real preshower ADC values so apply no RMS is applied in this analysis.
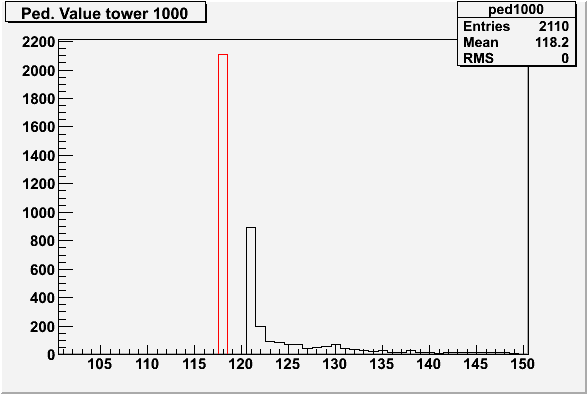
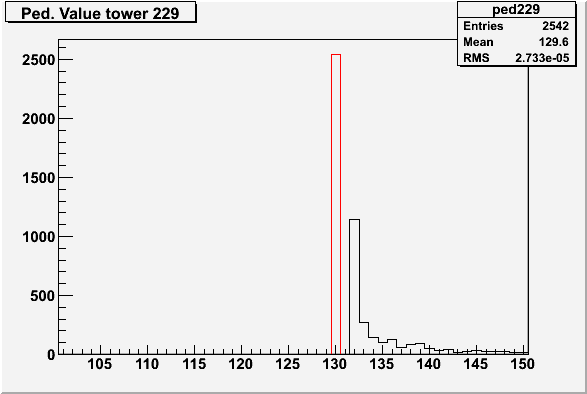
The database value for the mean pedestal value for the pre. shower for tower 1000 was given as 118.25 and for preshower 229 as 129.65.
In the folowing plots, the bin size is 50 bins and the Pedestal mean from the data base (red) is plotted on the raw pedestal ADC value for comparison:
The following plots have been corrected for the mean (but no cut has been applied for the rms).
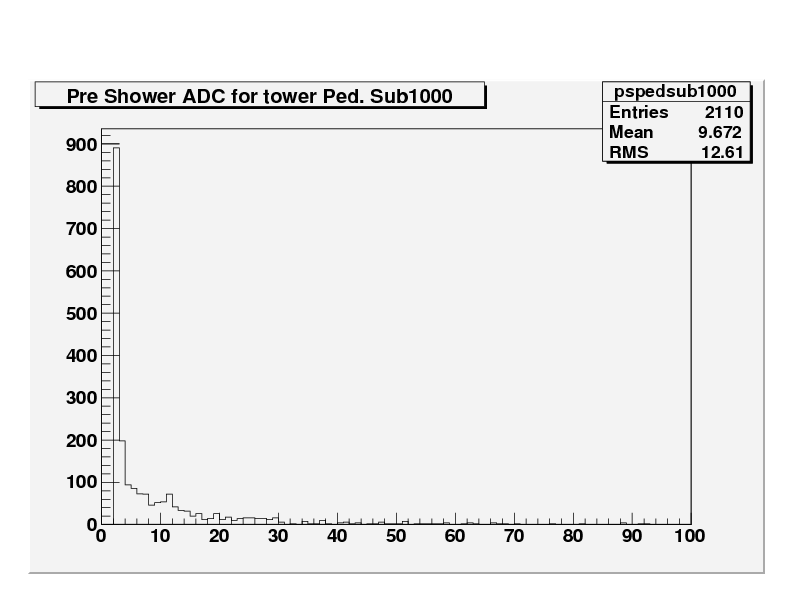
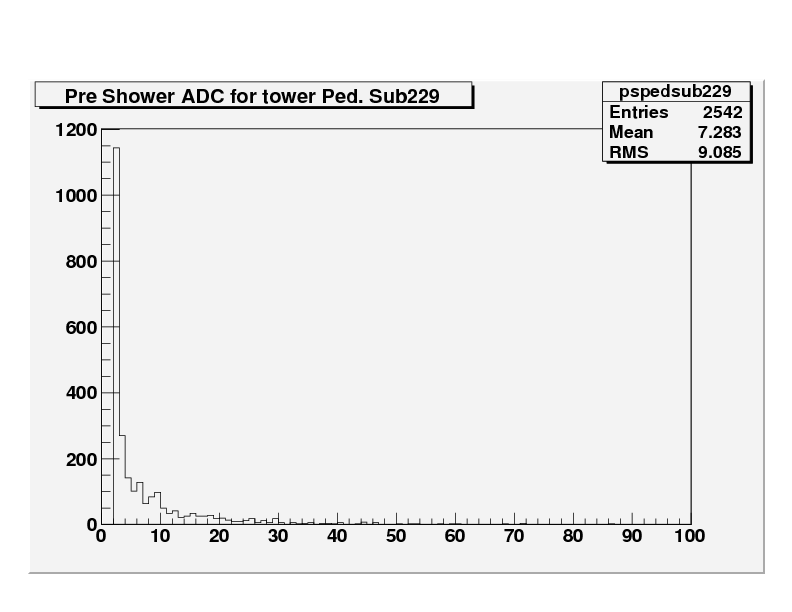
Next the stability of the database mean was checked by scanning all the towers for the difference of the database mean to the first bin of the ADC value, i.e, from the first plot above, the difference of the red bar to the first bin of the raw pedestal ADC vaues
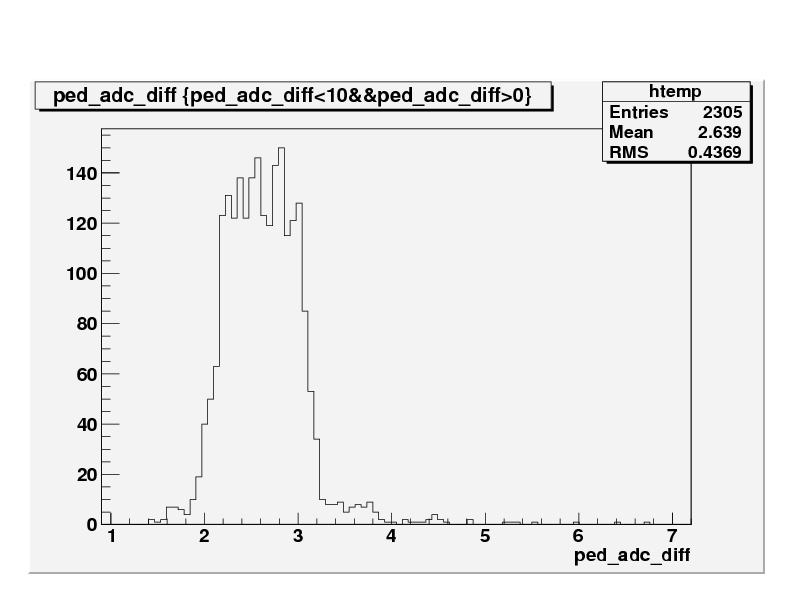
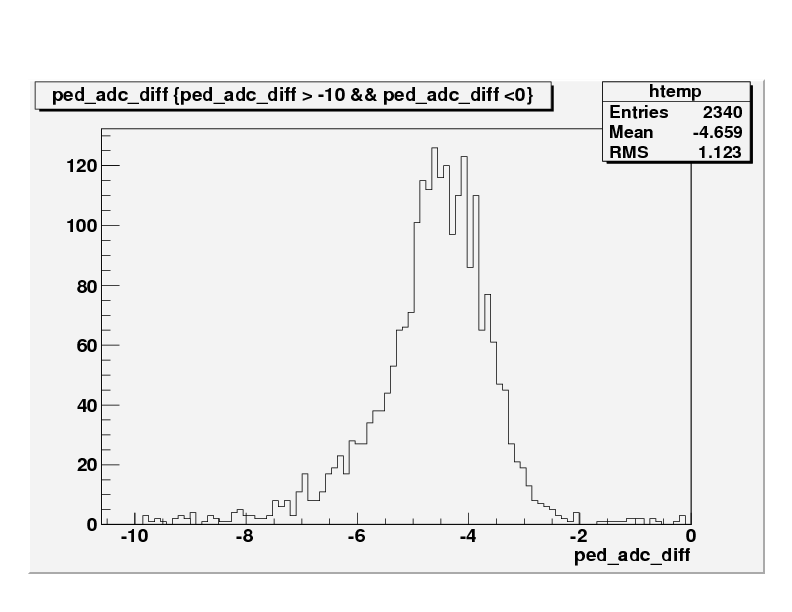
For a comparison, the full towers were also scanned. For this case the distribution is on the left of the x=0 axis as opposed to the preshower, where the distribution was on the right of x=0.
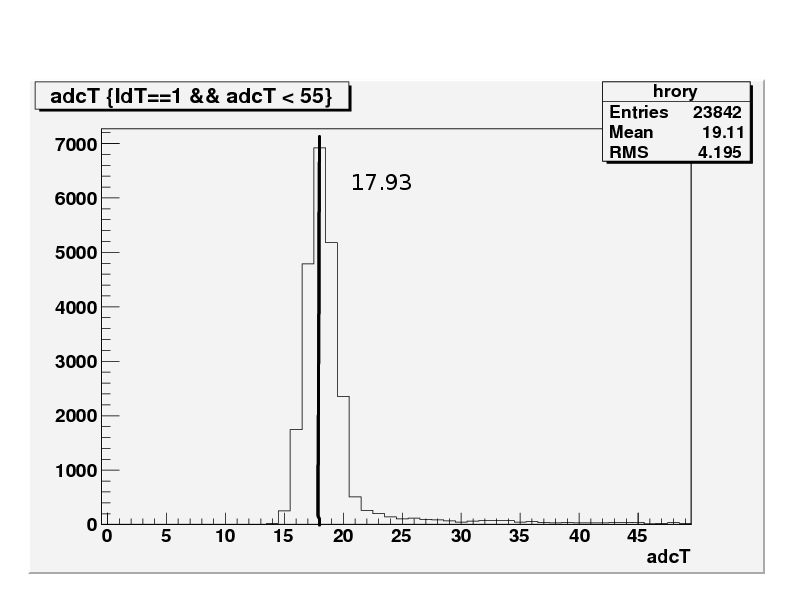
Tower day 49 2005-02-19 10:16:43
Ped is > Adc Min for Tower
Ped is < Adc Min for the preshower
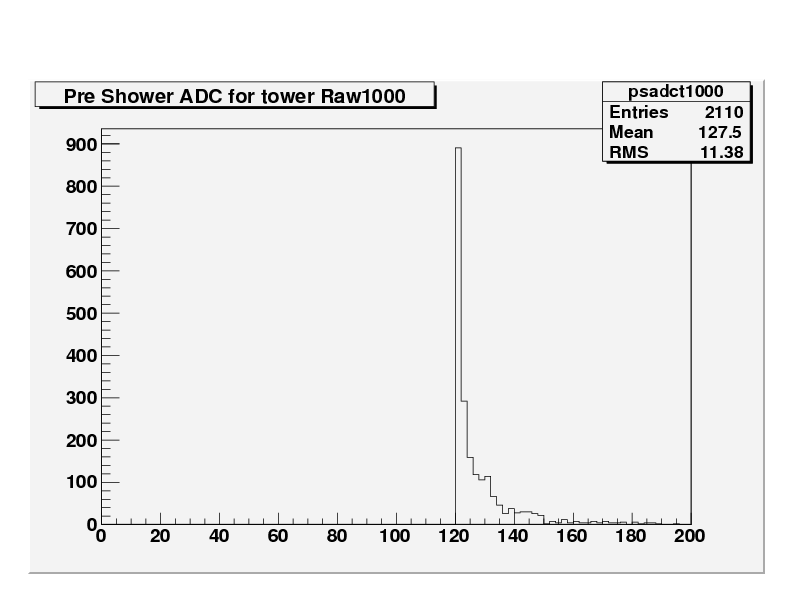
For the tower, 17.93 is on the peak of the distribution. Somewhere, it seems that the raw preshower ADC distribution has been cut, with a sharp cut off at the first data bin. The tower distribution looks more like a Gaussian + exponential.
It seems that somewhere an ADC cut has been made in the preshower data giving this exponential like distribution of the raw ADV values.
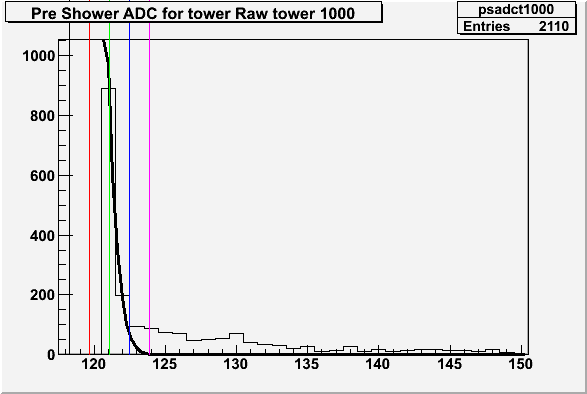
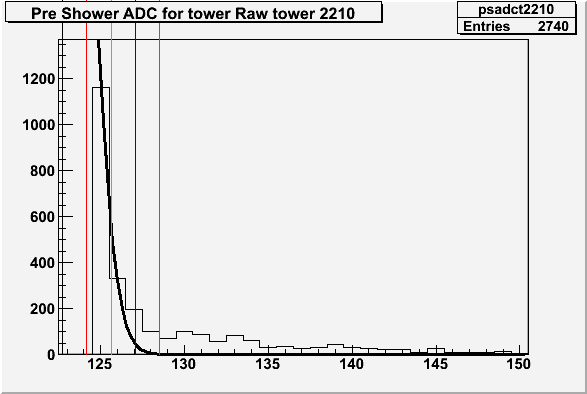
The next investigation involved fitting a Gaussian using the mean and RMS from the pedestal database to the preshower distributions. To estimate the amplitude with the preshower cut we assume that the first bin is still "inside" the Gaussian. Using the first bin, a Gaussian function was fitted, with the mean and RMS fixed and the Amplitude allowed to vary.
In the following plots:
Thick black line = 1/2 Gaussian fit
Black line = Mean
Red line = Mean + RMS
Green line = Mean + 2*RMS
Blue line = Mean + 3*RMS
Purple line = Mean + 4*RMS
Ps Id= 1000, Ent= 2110, Mean= 118.25, RMS=1.40
Ps Id= 2210, Ent= 2740, Mean= 122.74, RMS=1.44
Ps Id= 223, Ent= 2740, Mean= 130.99, RMS=1.39
From this analysis, a cut of 2.5*RMS seem to be safe for removing the pedestal during calibration of the preshower