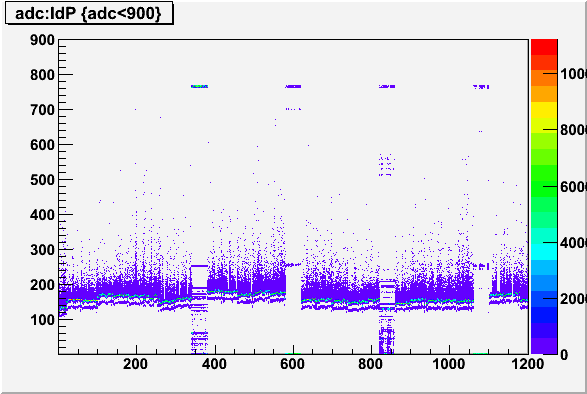
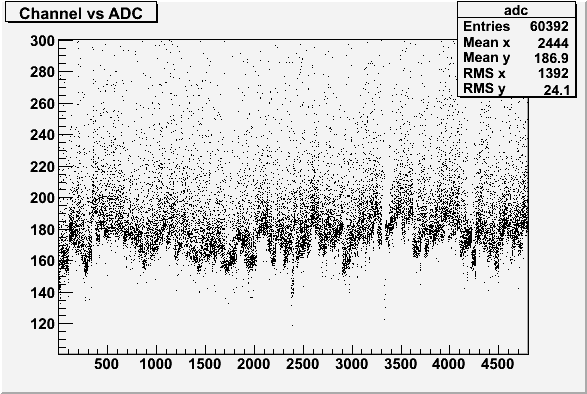
Using the same idea as the "P" plots, an adc vs. soft Id. plot was made to see the quality of the preshower data
The runs shown here cover the good set of data from the Indiana runs, 7101013-50
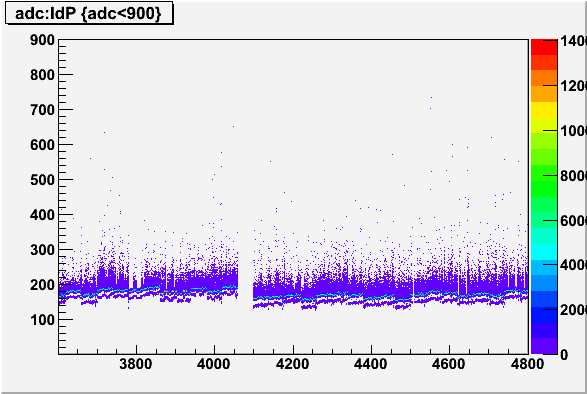
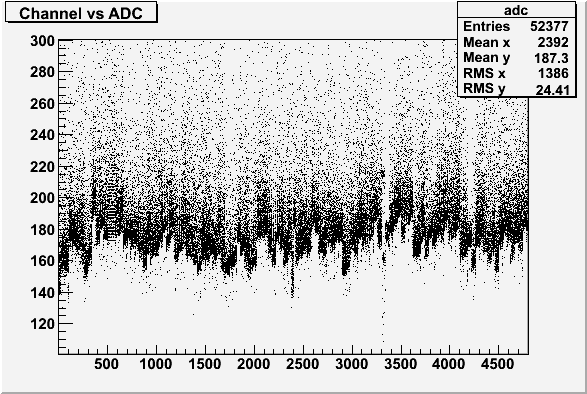
This can be compared to the 2007 data, which is much improved!
Everything is there, there are no gaps in the data, there are sections where we only have pedestal but this could be due to mapping as well as a fault in the PMT
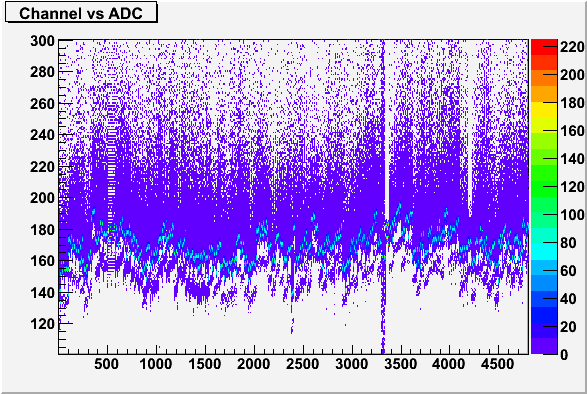
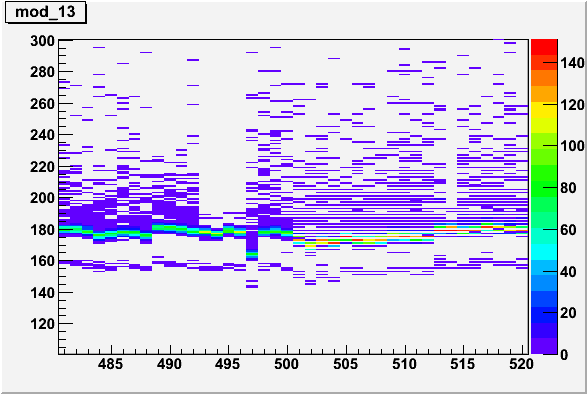
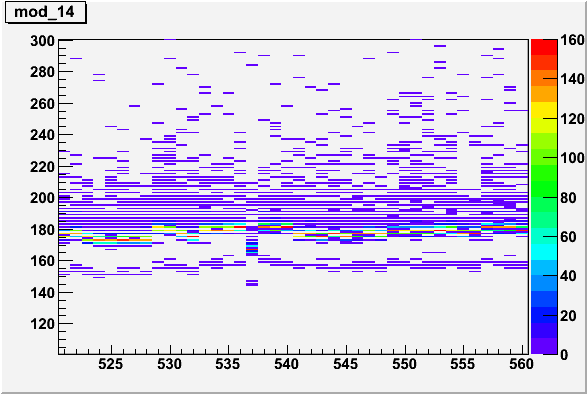
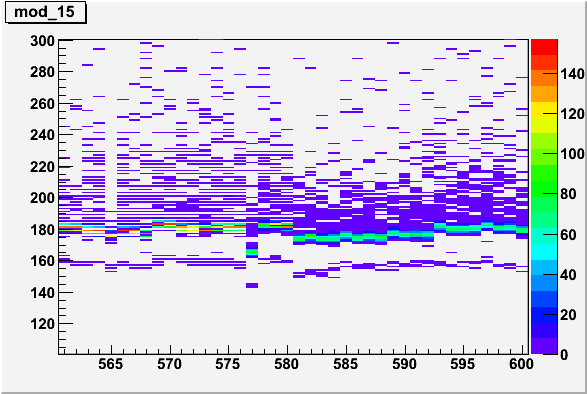
This plot was broken into PMT modules for closer inspection see this link:
Modules ADC vs. ADC (no tracking)
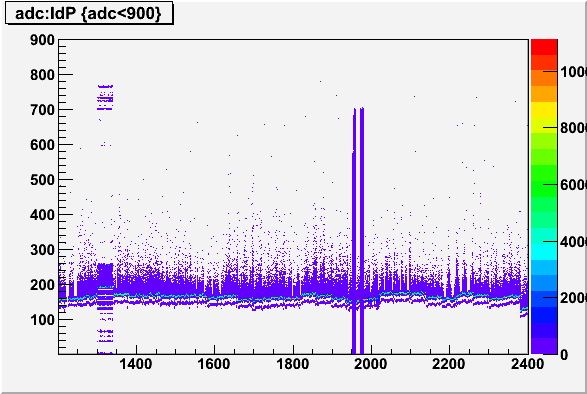
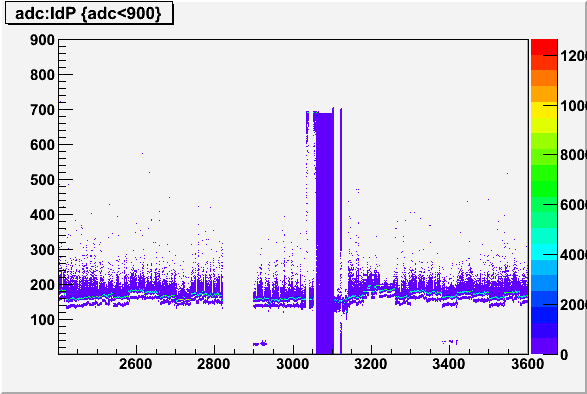
There seems to be a range of "stuck bits" which line up with crate PMB23W:
Stability of the data looks good, adc vs. soft Id. show bands of hot channels but overall the plots stay the same for different runs checked
Two different runs from FastOffline dir:
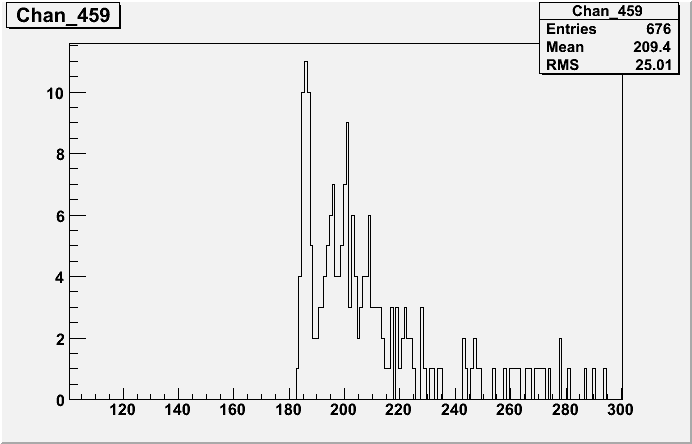
Looking at the online database and comparing it to the data with tracking and with no tracking the pedestal mean gives a good fit
Using the data with tracking and attempt to find MIPS in the 2007 data. At the moment the statistics are not high enough to get clear plots but I am adding more files from the HPSS
Also, I need to add the trigger data to the code, I am after the Min Bias trigger but could not see that this was set up in the call to
"myEvent->triggerIds = triggerIds()"
With that in mind, the preliminary plots for the 2007 data with 400K events (about 2 runs)
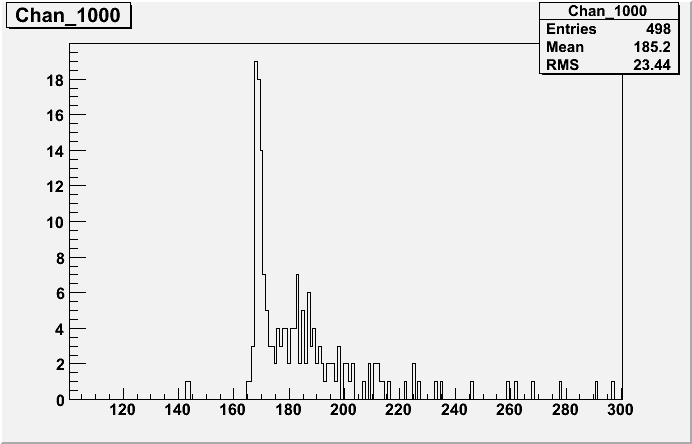
Note: from data base pedestal day 99: 184.51
Note: from data base pedestal day 99: 168.21