From last week: I have been trying to see if it is possible to see a mip peak in the data and if so, how well is it seperated from the pedestal, i.e is this data useful.
The problem with the data last week was the statistics were low. With the low statistics a basic QA can be done
I started to looked at the data without tracking to see how the distributions change with gain, but there were areas with a large difference compared to the plots with traking
Images of modules without tracking
For the traking plots I scanned by eye the first 2400 plots. A high number of adc plots looked as if they were just pedestal with no "physics tail". However, the plots that were like this seemed to form groups. If we were to move forward 20 channels the same group of empty plots were seen again. There were also big groups of 160 empty plots suggesting crate level mapping problems.
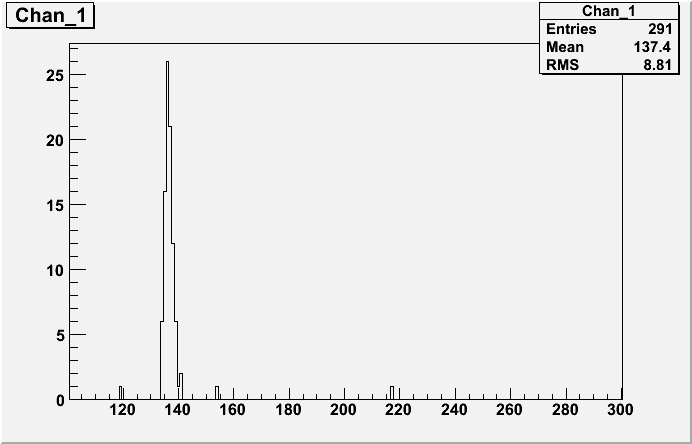
Example of pedestal only plot
These are my notes in a pdf file:
Mapping from pedestal only plots
These are my notes from a scan of these plots:
2007 West side (Soft Id 1-2400) Swaps
With tracking, the preshower plot will have a pedestal and some sort of physics tail. If only pedestal is seen in blocks of 4/8 or regions of two crates a mapping problem is suspected.
The crate locations were taken from the diagram found at:
http://www.nikhef.nl/~ogrebeny/emc/files/Towers%20Layout.pdf160 channels, crate level swaps:
PMB30W<->PMB1W 1-20 then wrap round barrel to 2261-2400
PMBW9<->PMBW8 1621-1780
8 channel swaps +/-20 channels located in 4 rows of a PMB boxes:
PMB16W (and PMB15W row 1)
Centre of row 1,2: 1069-1076<->1089-1096
RHS of row 3,4,(1): 1101-1108<->1121-1128 <->(First Row PMB15W) 1141-1148
PMB2W: 2245-2252<->2225-2232<->2205-2212<->2185-2192
Other 8 channel swaps +/-20 channels:
PMB12W row 3,4: 1421-1428<->1441-1448
4 channel swaps in 4 rows of a PMB box:PMB26W: 269-272<->289-292<->309-312<->329-332
PMB24W: 433-436<->453-456<->473-476<->493-496
PMB5W: 1957-1960<->1977-1980<->1997-2000<->2017-2020
Other 4 channel swaps +/-20 channels:
PMB7W row 1-2: 1797-1800<->1817-1820
PMB4W row 1-2: 2033-2036<->2053-2056
This suggests that 408 towers have bad mapping in the west side and that 20% of the "dead plots" will be fixed with a mapping correction
This is not however the same as 2006! What is going on here? The crate level swaps may explain some difference but not all:
This is not easy to give a clear answer with the low statistics. There does seem to be areas of good seperation and areas where the gain could be improved but it is not clear so last week I increased the amount of data by an order of magnitude and this is running to remake the plots, I will post this as soon as it has run.