This is an analysis of the ADC spectra for the BPRS, it has three parts
1: Analysis of the ADC -Pedestal*rms*3.5 spectra over PMT crates
2: Analysis of the Spectra soft ID by soft ID
3: A basic slope analysis of the data
Data sample:
The sample contains data with the swaps from 2006 and without swaps
The data has the trigger ID range from 200000-200013
Tower adc must be greater than 2.5 pedestal
Runs less than 8088012 were dropped
About 2500 files have been analised from the HPSS
The pedestals were subtracted and each PMT crate was plotted. The idea would be that on a colour 2D histogram that mip peaks would be easy to see as "red" areas close to the ADC=0 axis
The MIP peaks in the ADC spectra seem to show up as positive slopes (red zones) in bands of 20 channels on the background. Going through the plots one by one, hot and dead channels cut into this pattern and can be used to estimate the amount of the preshower that will be lost in the final analysis. Also, with some hot PMT boxes, the pattern can be seen in the background and could be used to salvage data in zones of bad channels.
I noticed that there were gaps at the "wrap" of the BPRS round the barrel (see PMT 30 for example), any gaps here are likley a bug, not dead channels.
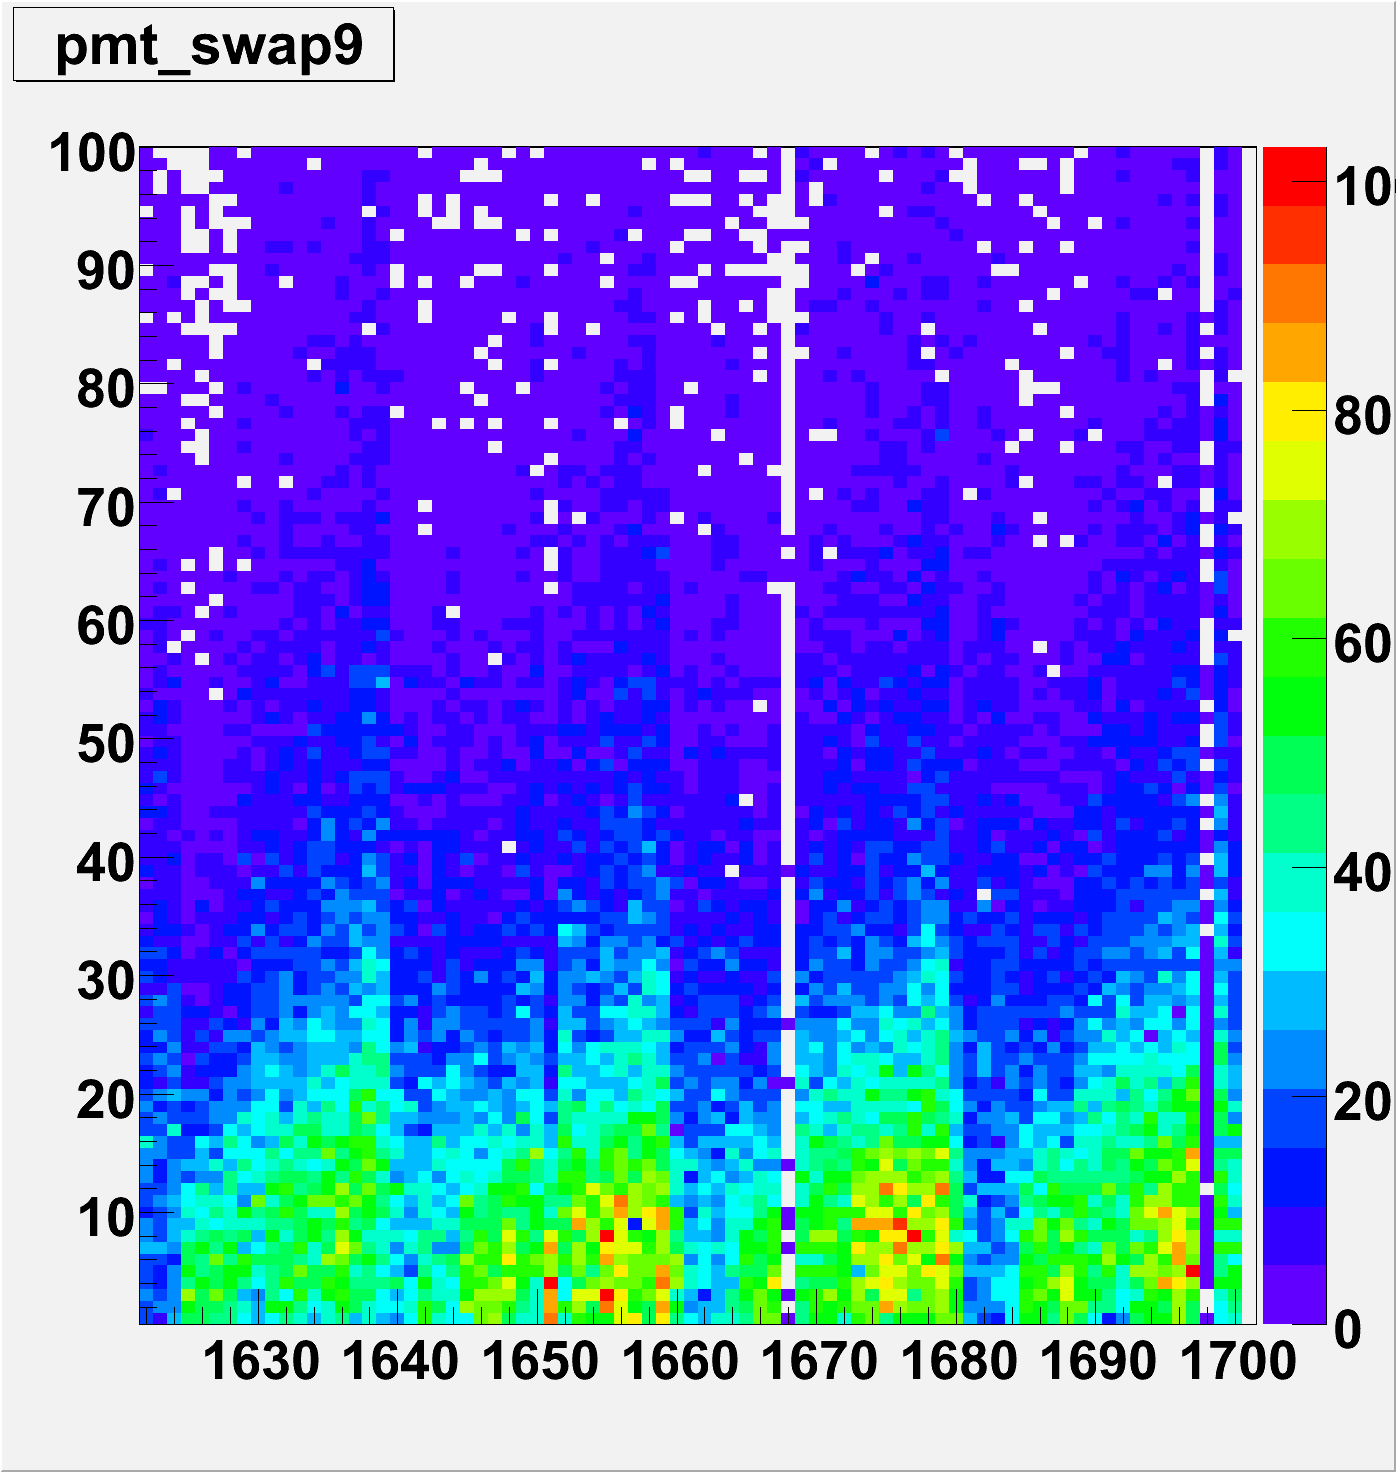
Plots for the preshower NO SWAPS
Plots for the preshower WITH SWAPS from 2006
The adc, pedestal subtracted was first plotted vs. the momentum reconstructed from the tpc. This did not show any clear signs of seperating the tail from the possible mip peak so was dropped in further analysis
Note: the large peak is not the pedestal when compared to the data base.
The following plots are produced for each soft Id over the whole bulk of the data.
The fits are made to give an idea of gain adjustments needed for the PMT boxes.
The function is [0]*exp(-0.5*((x-[1])/[2])**2)+[3]*exp(-[4]*x)
Top left ADC raw no swap
Top right ADC raw with 2006 swap
Mid left ADC, pedestal subtracted, no 2006 swap, basic fit
Mid right ADC, pedestal subtracted, with 2006 swap, basic fit
Bottom left ADC, pedestal subtracted, of the tower
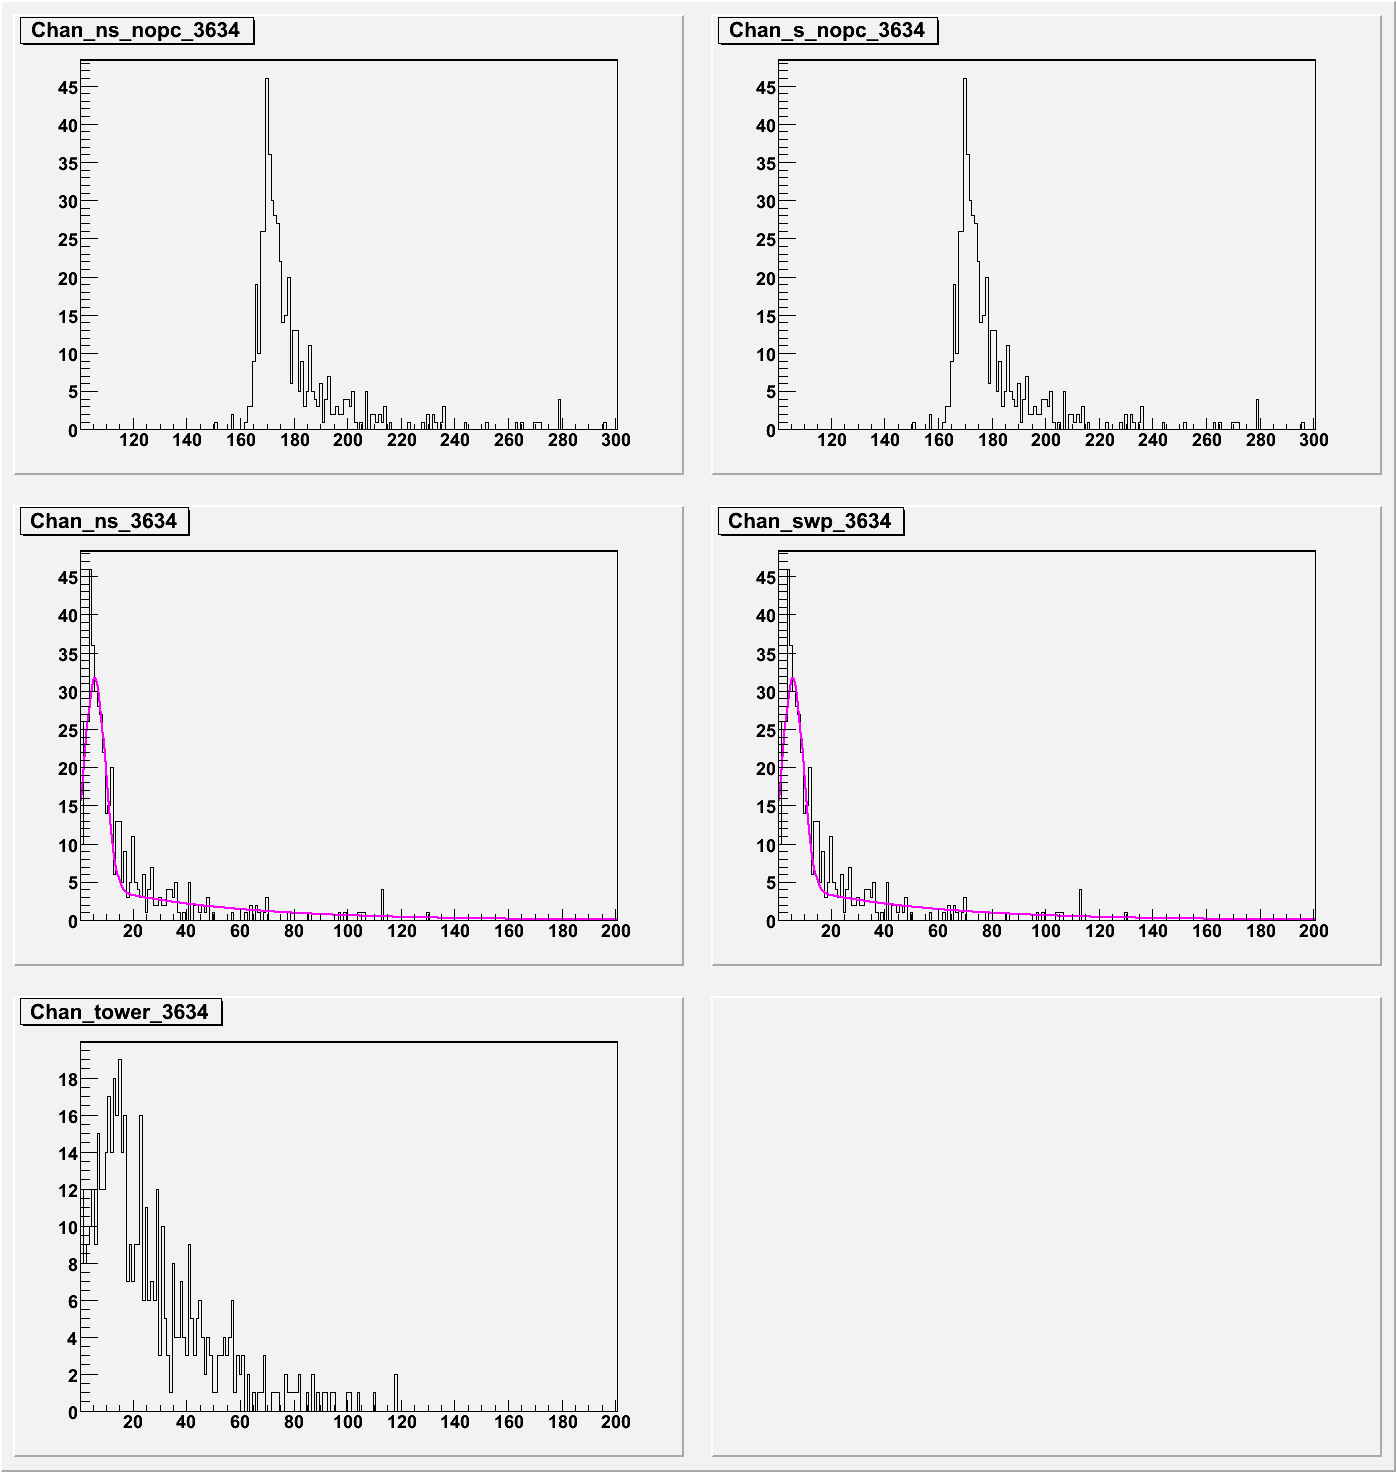
The fits from the function seem to work most of the time but will probably need to be tuned
Here is an example of a first fit
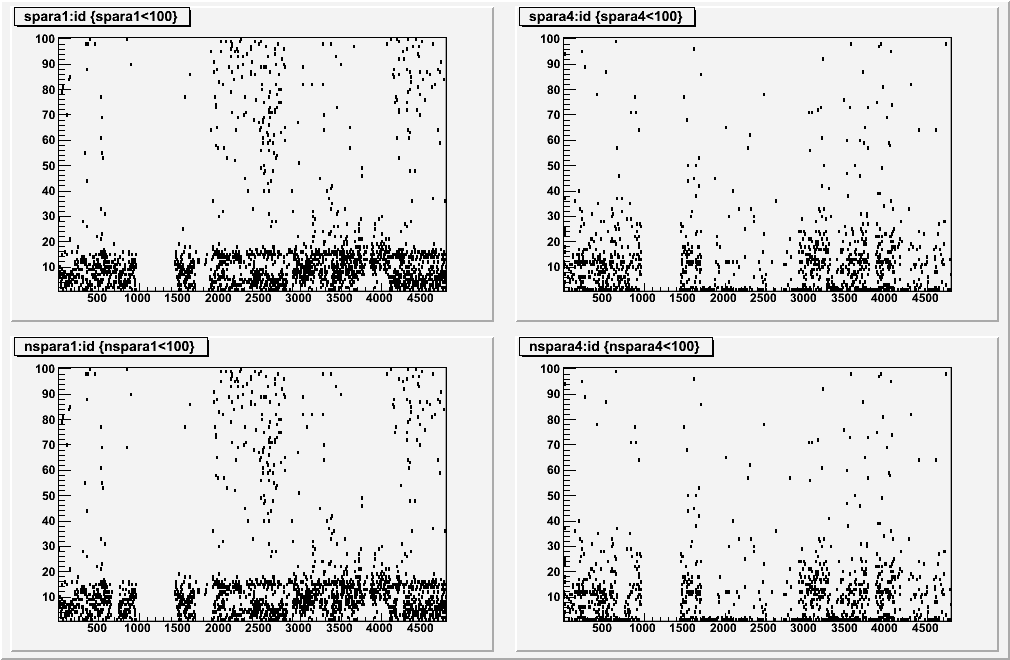
Par 1 swap Mip peak
Par 4 swap Exponential slope
Par 1 no swap Mip peak
Par 4 no swap Exponential slope
 I will add magnified versions of this on PMT boxes, for the moment, if you want to look, here is a link to the fits in a root file: