The study with the BEMC and tracking seems to show a difference with the slopes from data with no tracking and pedestal subtraction
To test this I took a run which had no tracking, 8095061. This was previous to changes to the BEMC gains during the end of the run
We are interested in the Tube array layout for the BEMC, these are units of 4x4 PMT tubes. I took some files from Will and produced a class that can read various useful information in from his notes on this
Rtube Class It has a few things it can return from these maps, here are a few of the more useful:The data for the tube layout came from Will and is stored in text files for ease of updating. One is a layout for the softID map, the other two files take care of the tube layout.
Will's layoutIn the EXCEL softID map I noticed that there were swaps, these seem to show up on my tracking data as well as pure pedestal and no physics. I will look a bit closer at this and they may be added as real swaps if that is the case
This class will also allow masking of bad data, I have added channels on Will's maps but there are more seen in the plots
This class may be useful in the future, so I have tried to write this as transparent as I can for a first attempt but it is probably far from any coding standards. If someone who knows how to do this can show me I can try to get it on the CVS.
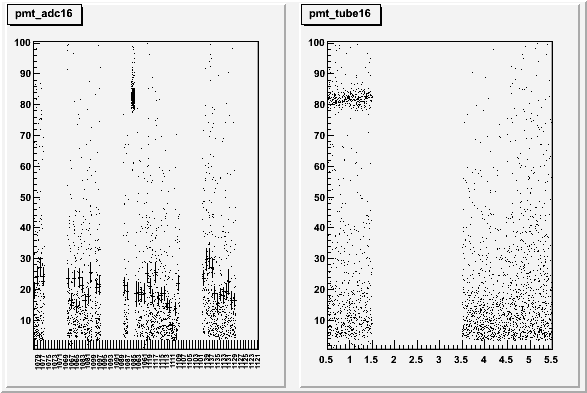
These plots show the ADC per PMT and the ADC per Tube Array in a PMT crate
The left plot is SoftID in a PMT crate vs ADC, the right is Tube number in a crate (1-5), vs ADC
This shows that there is a clear signal when part of a tube array is not working
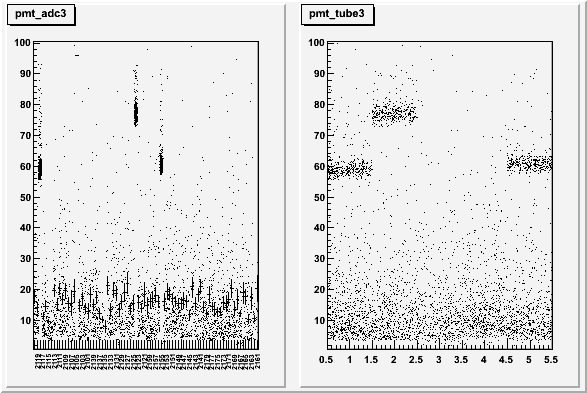
Also the channels missing from bad tubes show up as well
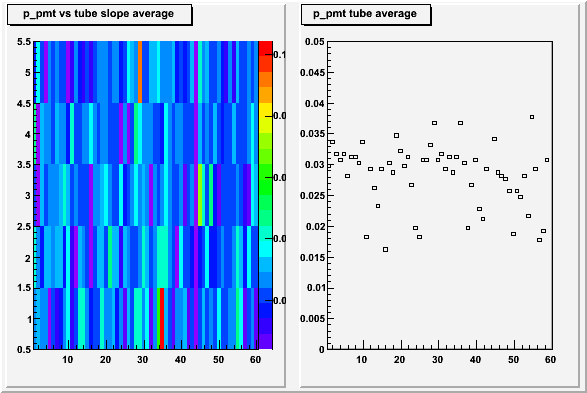
Finally the gains, A 3 sigma cut was made to remove the pedestal and then an exponential tail was assumed and fitted by taking the log of the ADC and using a simple least squares fit. The 2D colour plot on the left shows these fits taken over each tube array, the colours showing increasing slope value. The plot on the right is the slope value vs. PMT crate