The bad preshowers were found in three steps
- First, find preshowers that fail the pedestal fitting test
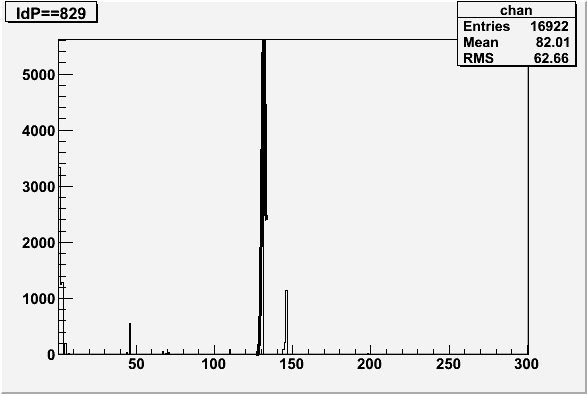
- Second, from the mapping investigation, peaks in the 1D plot where Preshowers above pedestal with tower below pedestal was made showed hot preshowers. A selection of hot towers from this plot were then made (see test 1 first plot)
- Third, find preshowers that look bad by "eye"
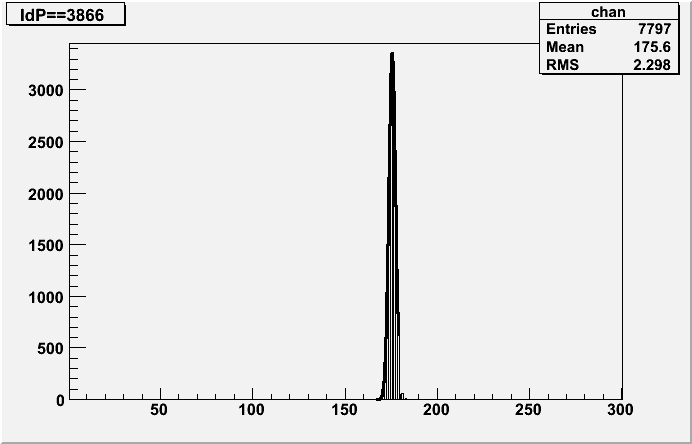
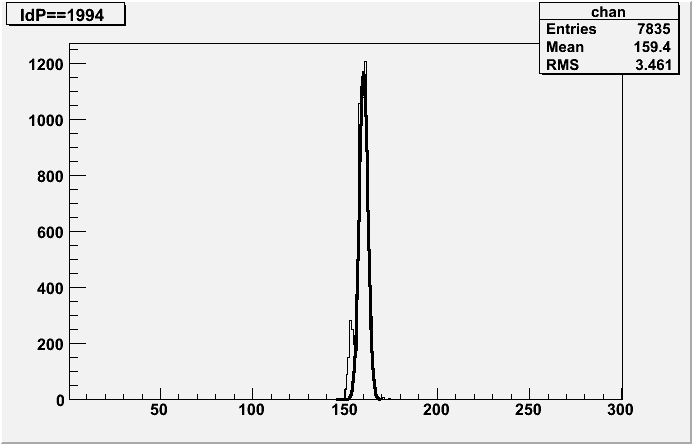
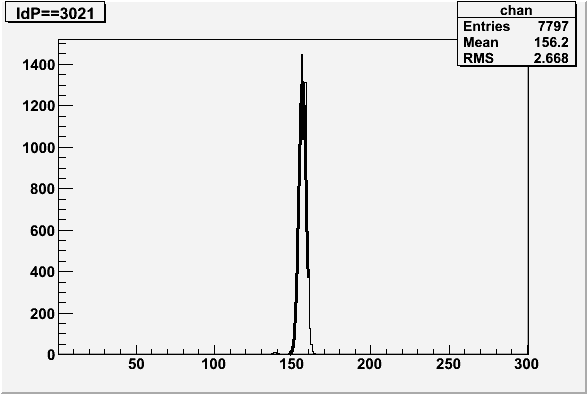
The first test lists the preshowers that fail to fit during the pedestal fit stage (see previous notes for this), this means that the events were too low to fit or the fit was out of range (The Rms > 0, Rms < 2.5, Mean ADC value > 100, Mean ADC value < 250)
The second test removed a few spiked towers from the "First Test" 1D histogram(Preshower>Ped, Tower < Ped, IdT==IdP)
Finally, what was left was scanned by eye to look for bad towers
For the first two steps, the bad preshowers are listed here
Note, the preshower # is the first column only, the other columns can be ignored:
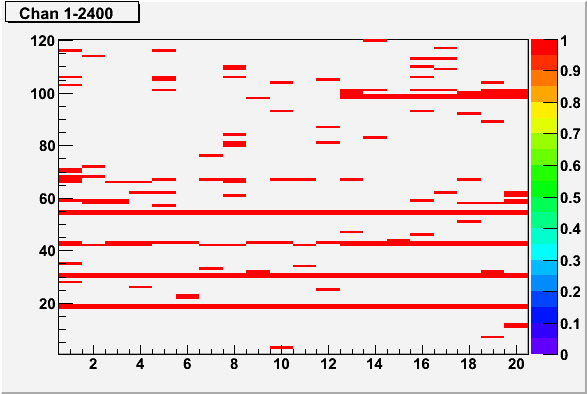
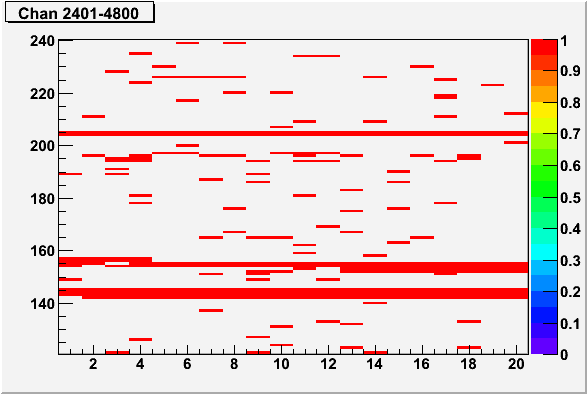
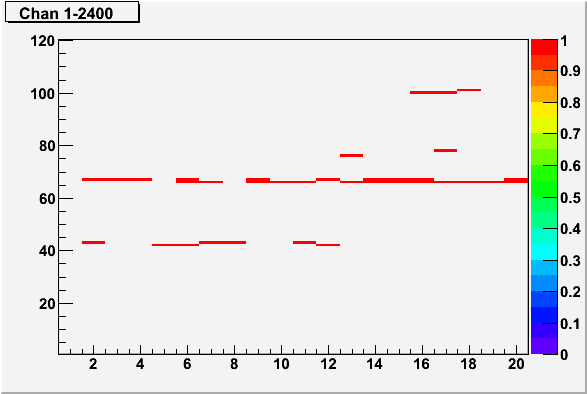
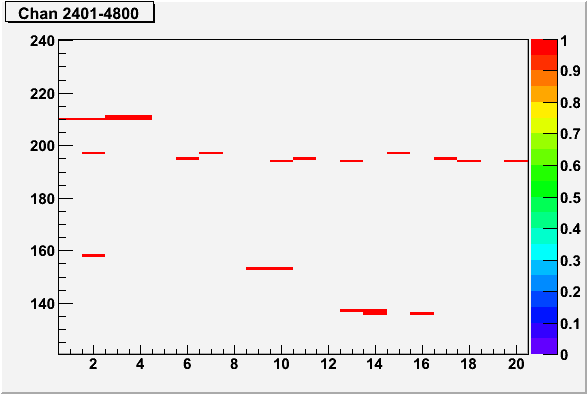
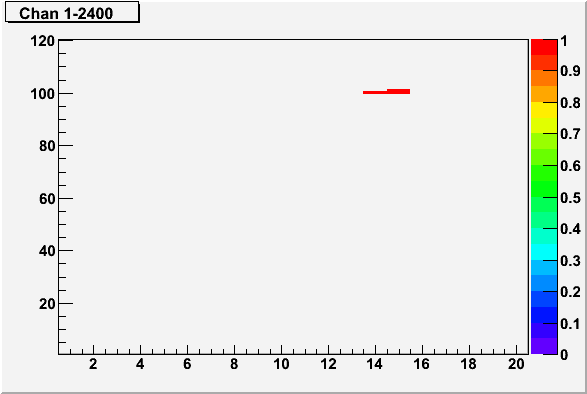
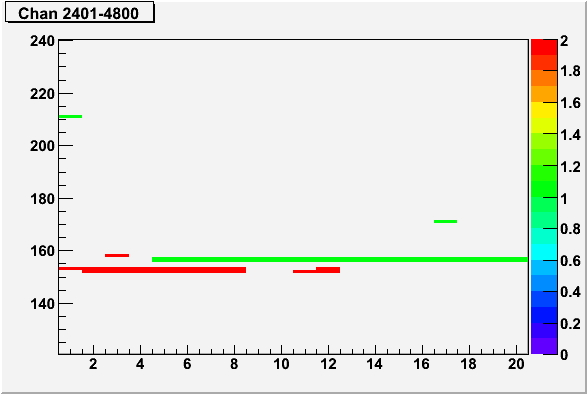
From fit list (544 chan) From map list (54 chan)A plot was made of the hot preshowers for clarity. The axis of the plot are given by the location along a modual (i.e eta bins) vs. modual number (i.e phi bins). They are 120 moduals which are 20 towers long that cover 1/2 of the barrel. The plots are divided into those that cover the East and West side of the barrel
Chan 1-2400 from fit
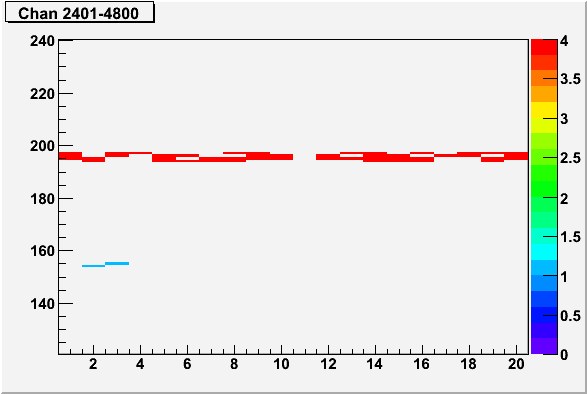
Chan 2401-4800 from fit
Chan 1-2400 from map
Chan 2401-4800 from map
By eye
The final step was to look at all the remaning preshowers by eye to see if there were any obvious problems.
In these preshowers, the colors represent the type of bad preshower that was seen
Here 2=Spiked and 3=Spiked and peaked at zero
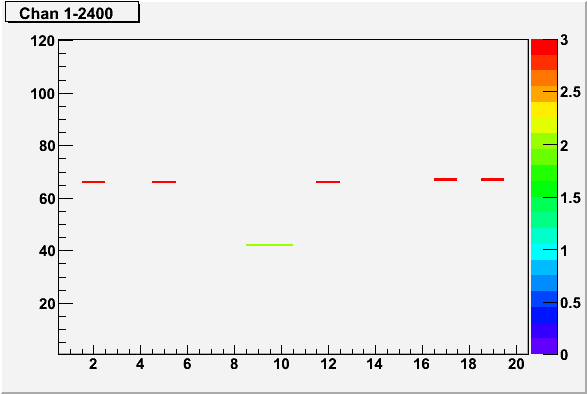
Here 1 = hot preshower and 4 = "Sliced Pedestal"
These preshowers were also seen with "double peaks", but the first peak before the pedetal, so they were not cut as the pedestal will be cut anyway. Capacitor maybe? The
Here 1= large peak on lhs, 2 = small peak on lhs (NOTE, colours swap on second plot!)
Bad preshowers by eye that were removed
Double pedestal on left NOT REMOVED but have a problem
This is a link to a list of all the bad preshowers from all the steps combined
Mappping replots
The mapping plot in 2d, made by comparing the Preshowers > 3.5 sigma over pedestal vs. the Towers >3.5 sigma over pedestal for each plot did not include the comparison, tower is equal to pre-shower, also, it had not been run over all the data
Mapping Webpage Notes 2D plot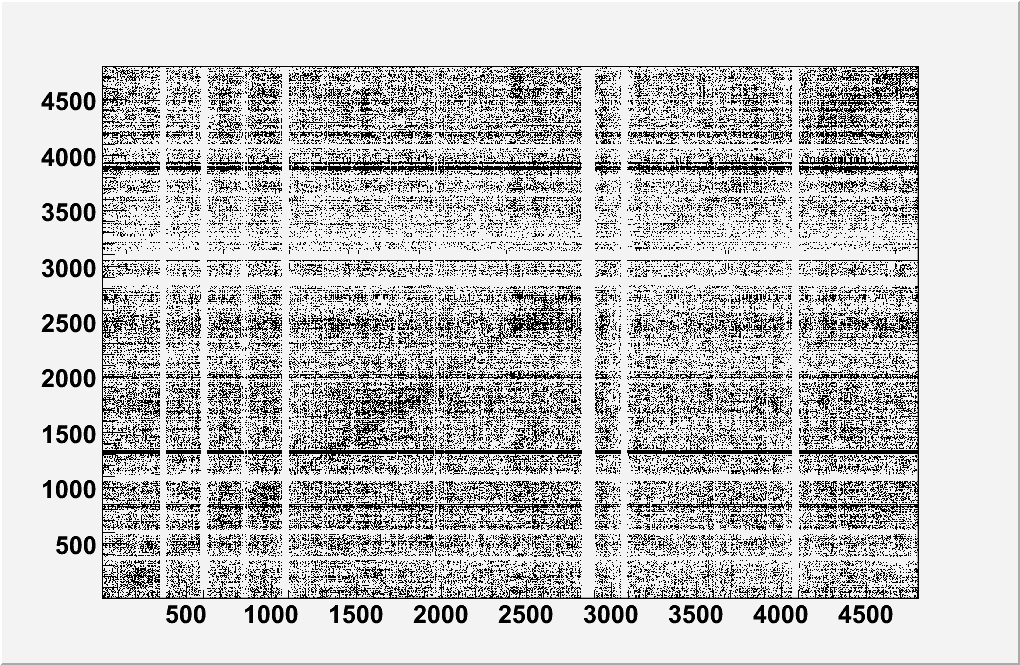
This has been remade with all the data and Tower==Preshower included. For clarity, from the suggestions from the phone meeting, it has been have split it up into East and West barrel plots (Chn num 1-2400, 2400-4800) and changed the default colours
Also, the plot was not as clear as it could have been due to the presence of some hot preshowers, these have been removed in these new plots using the preshower list from above.
The pedestal selection was varied from 3.5 rms to 6 rms but this made littel difference, typically the number of channels with IdP==IdT for this plot is about 0.7%
Chan 1-2400
For clarity cells with less than 20 entries were removed
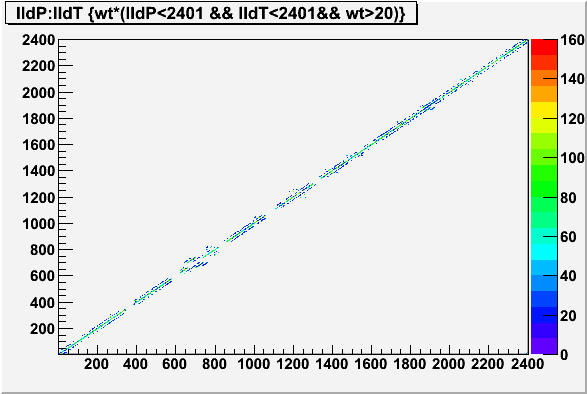
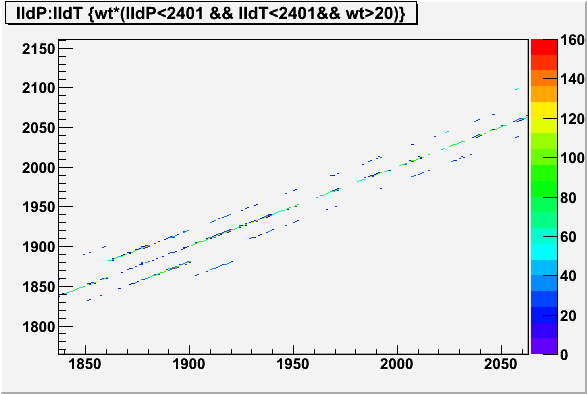
On the IdP==IdT axis, a couple of points were magnified, the first was at the lower end where the mapping may need to be checked
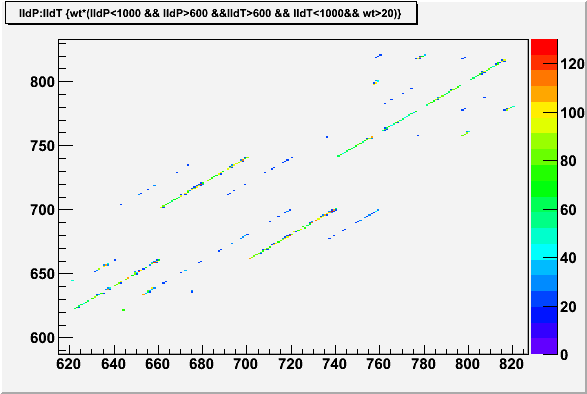
A point at the top was also seen but looked OK under a zoom
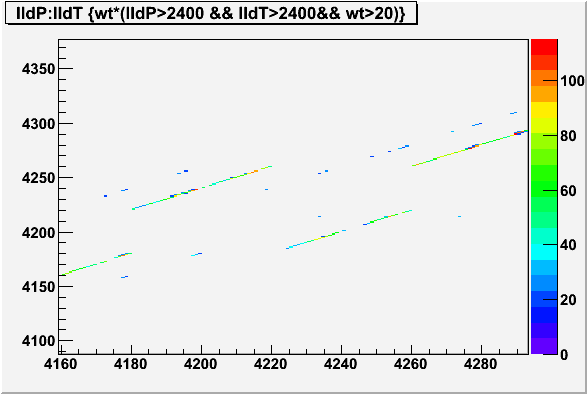
Chan 2401-4800
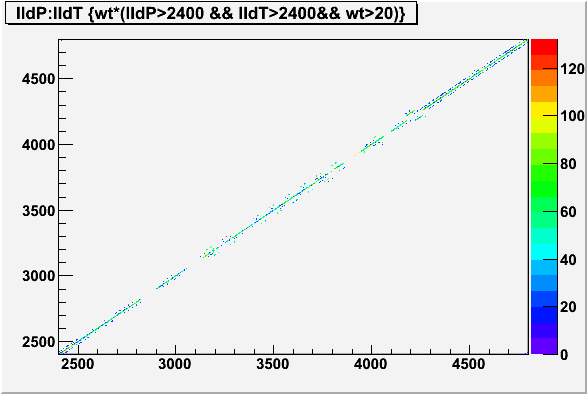
A cluster was seen at the top and this was zoomed
Summary
The bad channels seem to lay along (sub)moduals
Test 2, the 2d mapping was remade with IdP==IdT included
A few clusters are now seen and one point may be worth checking