The mapping issue has been looked at in more detail and it has been found that there are certain areas that need to be checked
The areas of interest were seen in a combinatorial method performed on an event by event basis, it progressed in three stages:
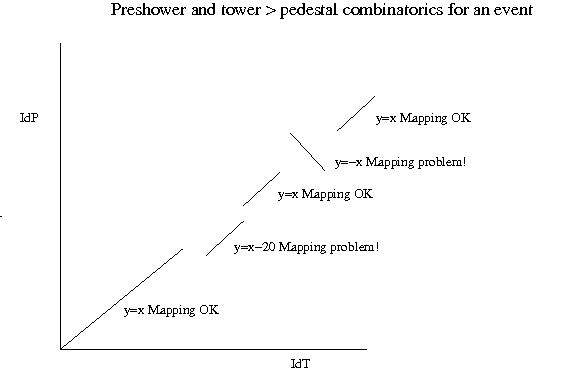
The reason that we suspect this to show mapping problems is because of how an event would look if the output were miss matched. If an event passed through the preshower and tower and the channel numbers were mapped correctly, then the IdP=IdT. The 2d plot of this would show, (against a background of combinatorial noise) an strong number of events along the line IdP==IdT, the y=x axis
As the channels are read out in "modules", each of which have two rows of twenty channels, if the "modules" wires were miss matched, it would affect the slope along the y=x axis, ie towers/preshower channels would shift off the y=x axis as a function of the bad mapping. We would expect the mapping to show up as "shifts" in units of 20, corresponding to the block of channels in a module or sub-module being miss wired
The shift would be something like IdP=(+/-)IdT+n.20
n = +/-(1,2,3...) depending on the module that is being miss read and "-IdT" expresses that fact that a negative slope would indicate that a module is being read out back to front, ie Preshower 1,2,3..20 is correlated to tower 20,19,18..1, although I have no idea how this would happen physically, this has been seen in the results.
The following is a graphic to demonstrate the above
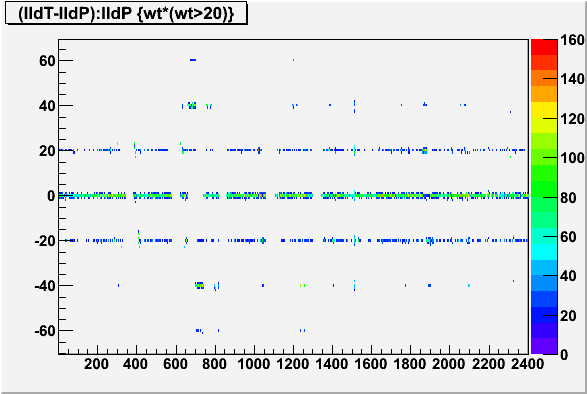
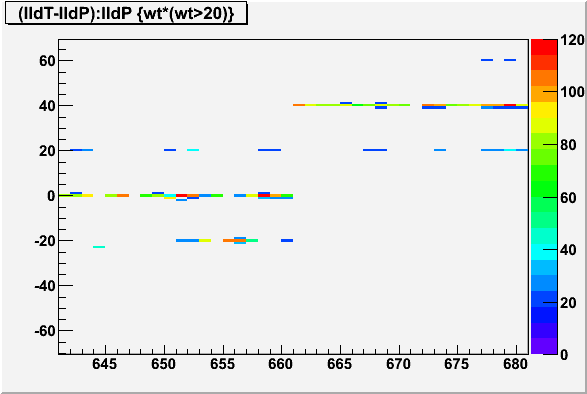
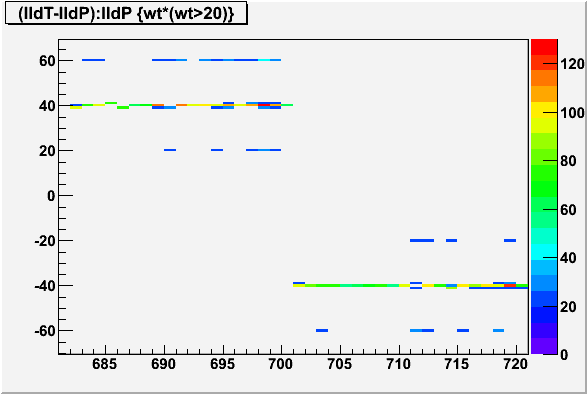
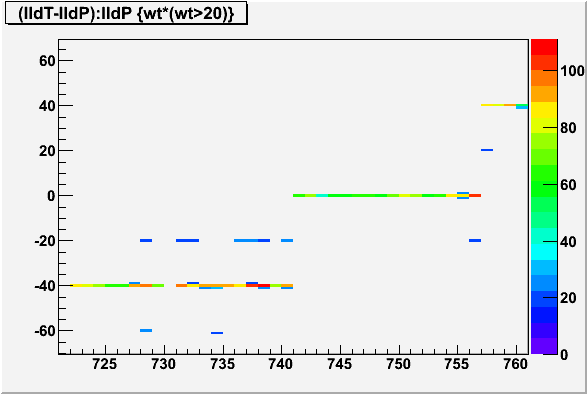
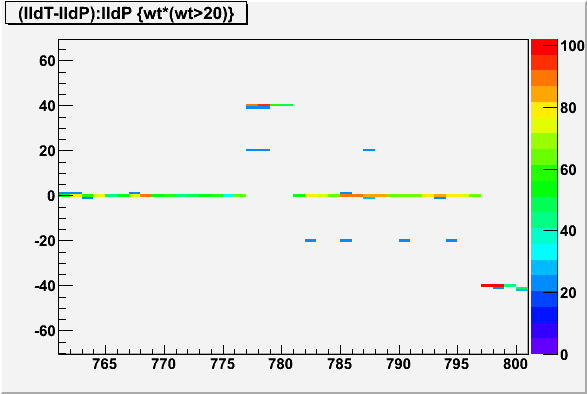
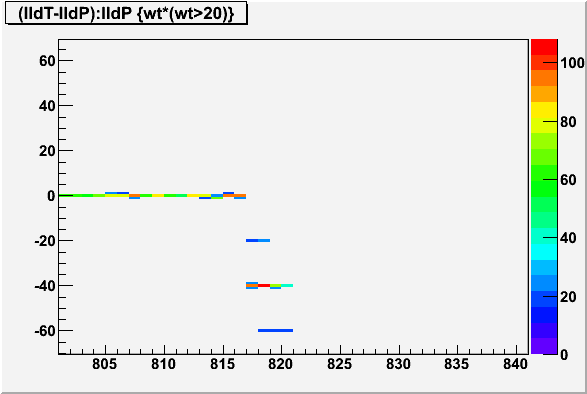
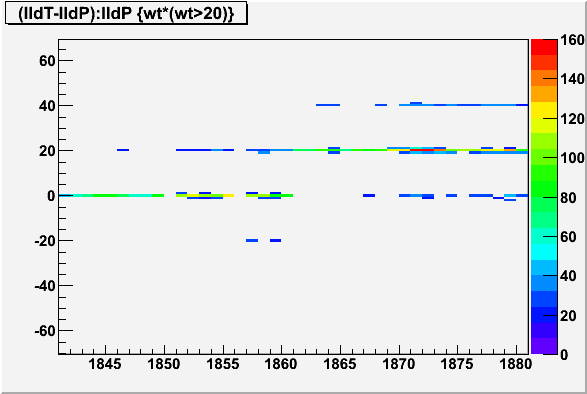
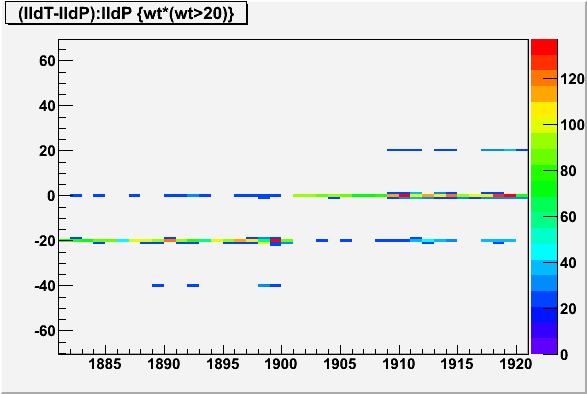
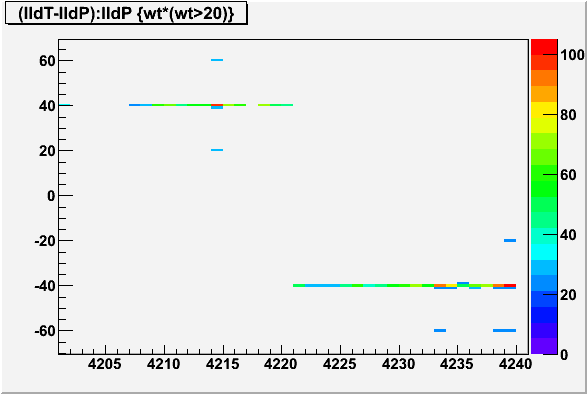
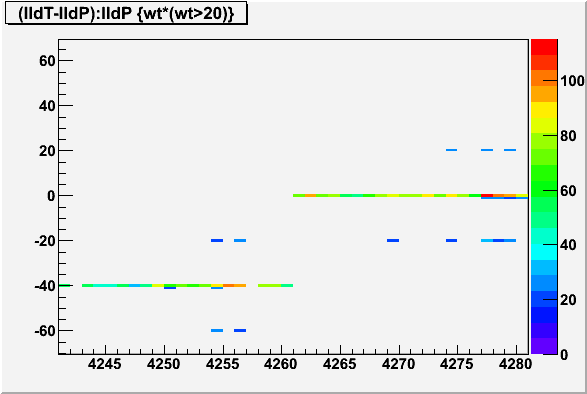
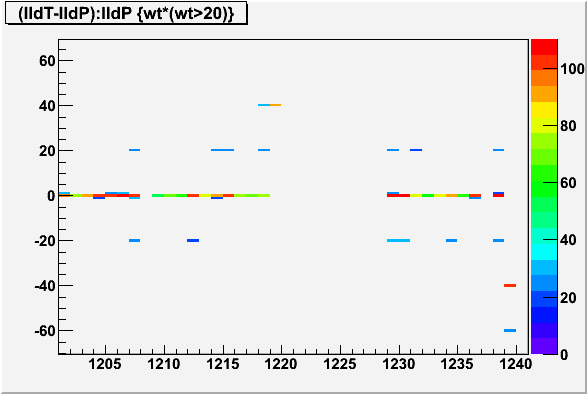
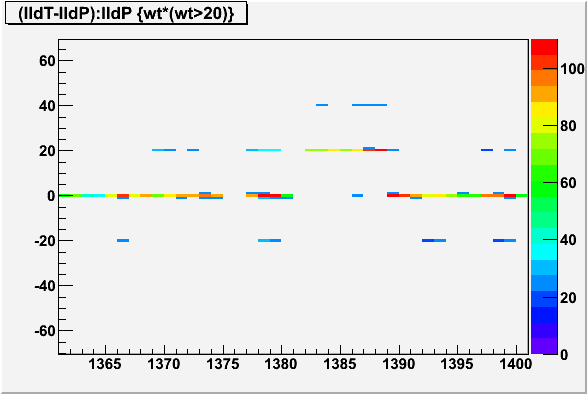
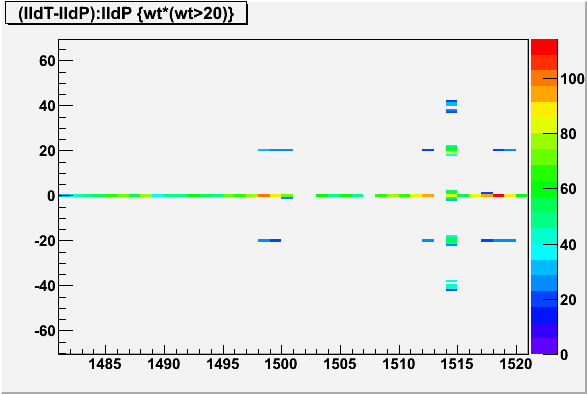
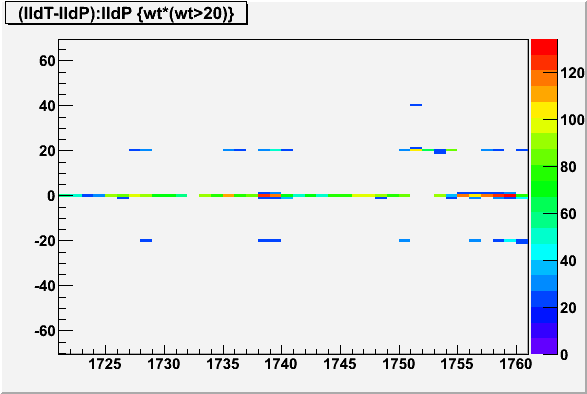
In the final plots shown here, the y=x axis has been rotated to the y=0 axis for clarity by defining: IdT-IdP vs. IdP, but it is essentially the same plot
The plot has been further modified by "cutting" all cells with less than 20 entries to remove the background and make the correlation clear
The plots have been divided into east side and west side BEMC scans, 1-2400 and 2401-4800
1-2400
2401-4800
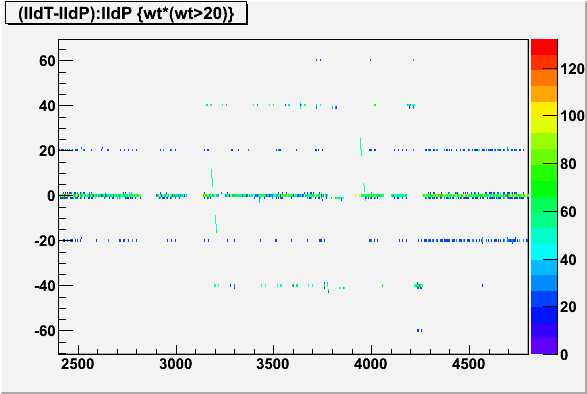
Looking at these plots, the Y axis shows a steady band along IdP for Y=0, with gaps that come from cut towers and preshowers. However, there are signs of mapping problems with negative slopes and shifts
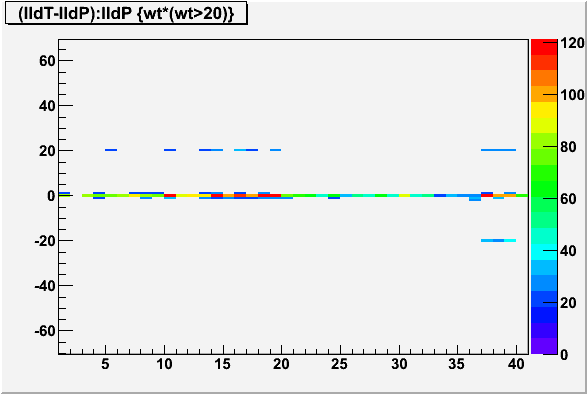
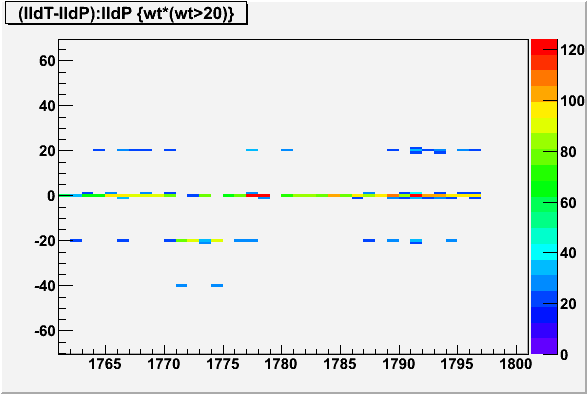
The next stage was to magnify these plots for a better look. The plot was zoomed in blocks of 40 along in IdP (120 zooms in total). 40 channels was chosen as this matched the length of a module
Example of "good" mapping
Example of miss match mapping
Example of miss match and reverse slope mapping
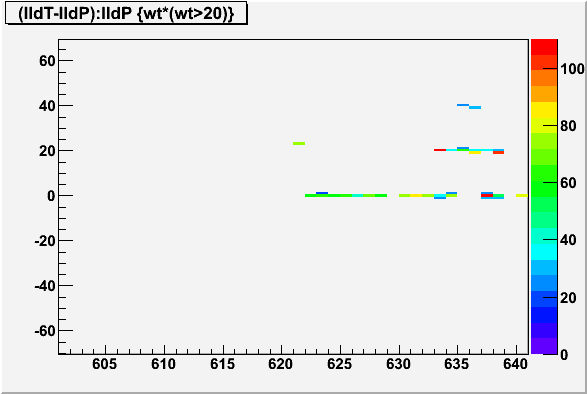
Mod. starting at 641, shifted second sub-module
Mod. starting at 681, shifted both modules
Mod. starting at 721, shifted first sub modules and some towers near end of second sub mod.
Mod. starting at 761, a few channels and neighbouring towers look shifted near 780 and 800
Mod. starting at 801, a few channels and neighbouring towers look shifted down 820
____
Mod. starting 1841, shift up in rhs
Mod. starting 1881, shift down in lhs
Cluster of bad modules
Mod. starting 4161, shift up in rhs
Mod. starting 4201, shift down in lhs,shift up in rhs
Mod. starting 4241, shift down in lhs
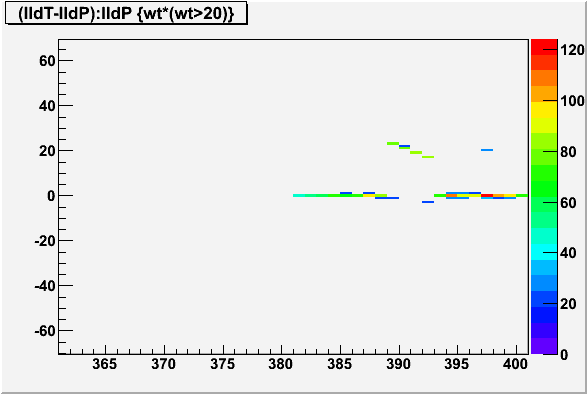
Mod. starting at 361, negative slope second sub mod
Mod. starting at 401, neg. slope in first sub mod.
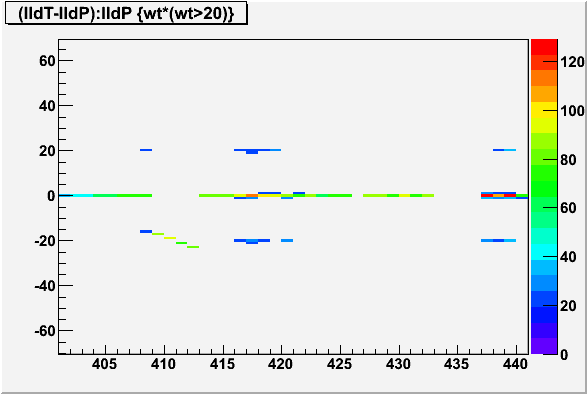
Cluster of bad mods
Mod. starting at 3121, bad at end
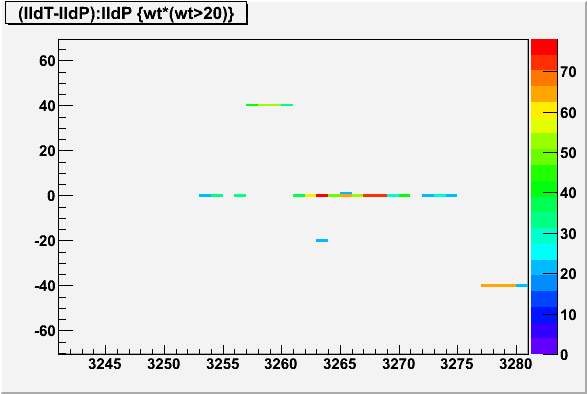
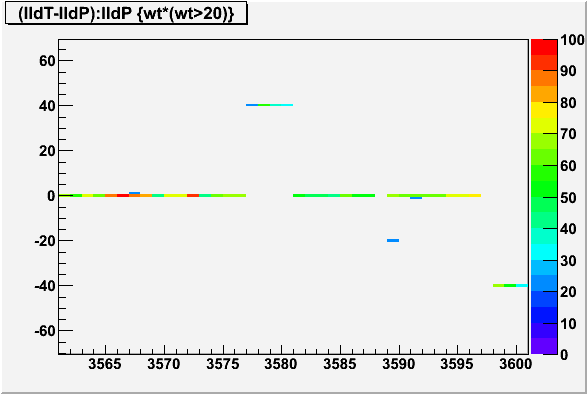
Mod. starting at 3161, neg. slope in round 3190.
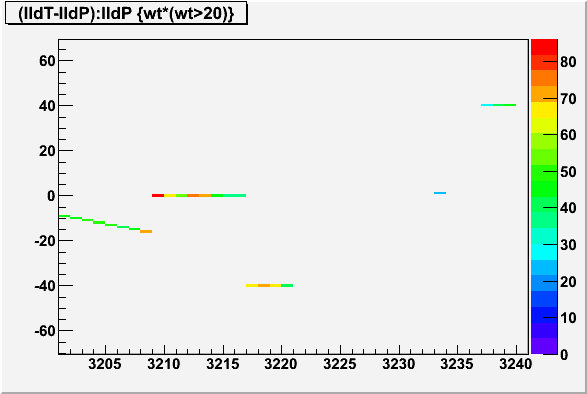
Mod. starting at 3201, neg. slope in round 3205 and looks like problems at rhs.
Mod. starting at 3241 looks like problems with high/low cluster around zero.
Mod. starting at 3281 looks like problems with low cluster around zero.
Cluster of problems here
Mod. starting at 361 looks like problems with high cluster around zero.
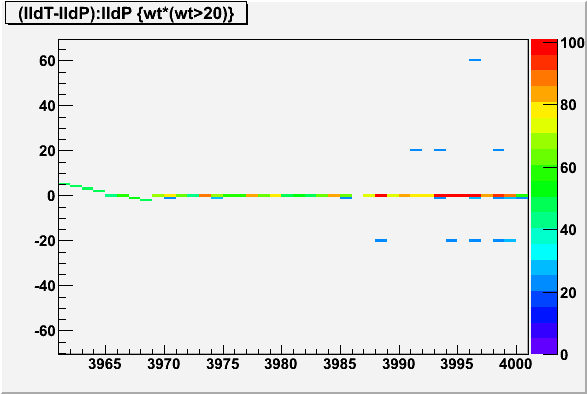
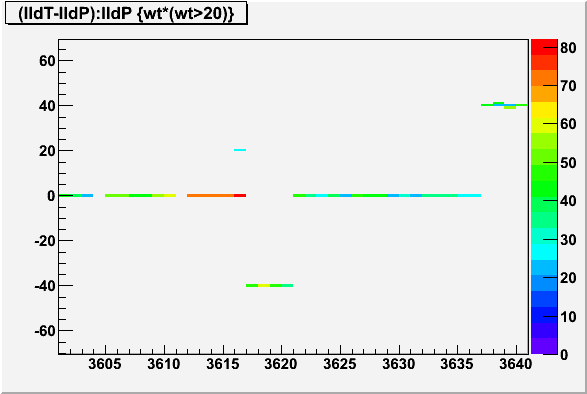
Mod. starting at 3401, small neg. slope and high-low cluster in rhs.
Mod. starting at 3441 high-low clusters.
Mod. starting at 3481 low-high clusters.
______
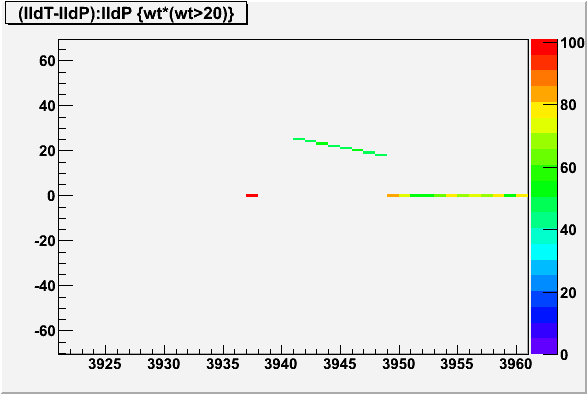
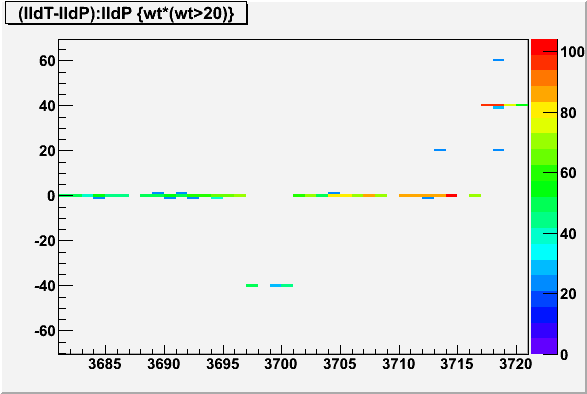
Mod. starting at 3921 negative slope
Mod. starting at 3961 negative slope
Mod. starting at 601, a few towers look shifted near end
Mod. starting at 1201, a few channels and neighbouring towers look shifted down 1240
Mod. starting at 1361, a few channels and neighbouring towers look shifted up 1385
Mod. starting at 1481, something strange at 1514
Mod. starting at 1721, shift up at 1754?
Mod. starting at 1761, shift down at 1775?
Small patches with high low clusters around zero for all the following,
3481, 3521, 3561, 3601, 3641, 3681, 3721, 3801, 3841, 4561 near lhs.
I think some plots show clear cases of bad sub modules. This comes from seeing adjacent plots, for example with the rhs high, the next plot with lhs high, rhs low and the third plot with lhs low. This pattern seems to correspond with the bus connections of the sub-modules,1/2 of one module, the adjacent module and 1/2 of the final module pattern.
The worst seems to be in the 2400-4800 region.
I sometimes see small patches, of 1-4 channels that look shifted, I have tried to list these under "weird", as for the negative slopes, this may be due to some readout electronics that need to be checked.
Bad modules have already been seen in the bad pedestal list here