This analysis has been conducted with the 2007 Upsilon data. The Upsilon trigger should make the data electron rich. We are looking at a raw dataset of about 4.5 million events. To this data the following cuts were made to select tracks:
These cuts put us in an electron rich region
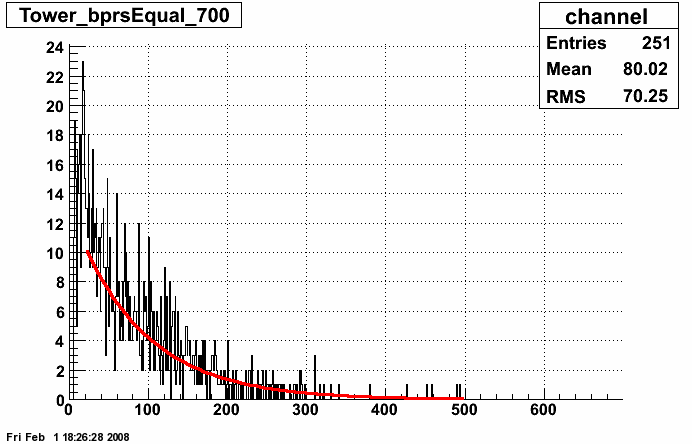
With this, the pedestal can be subtracted and a MIP peak can be seen. Next, two different fits were tried, a fit to the MIP and to the away side slope, with a Gaussian and Exponential combinations
At this stage the Towers were also fitted as a measure of how well these methods worked, some examples can be found here
At this stage the best fit was from an exponential to the right hand slope
The next stage was to calculate the gains, per channel, relative to a uniform slope in theta and a function of sin in eta
These results were presented a while ago and can be found here including a list of masked towers:
And a table of the good preshower channels can be found here:
Text file of previous gain with 2.5 overall factor added
We can now normalised to these gains, I added an overall gain of 2.5 to these channels to re-align the channels:
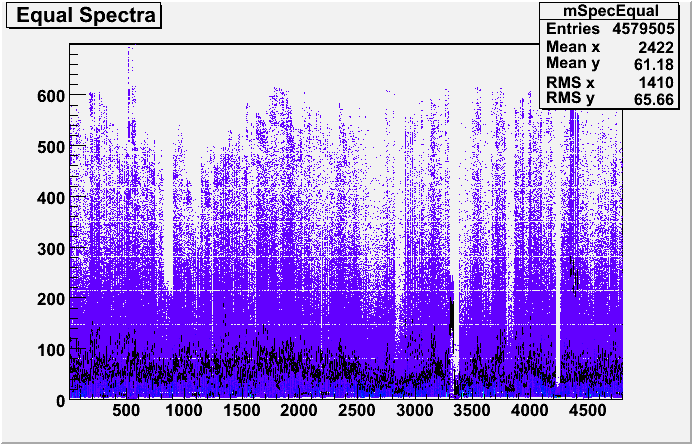
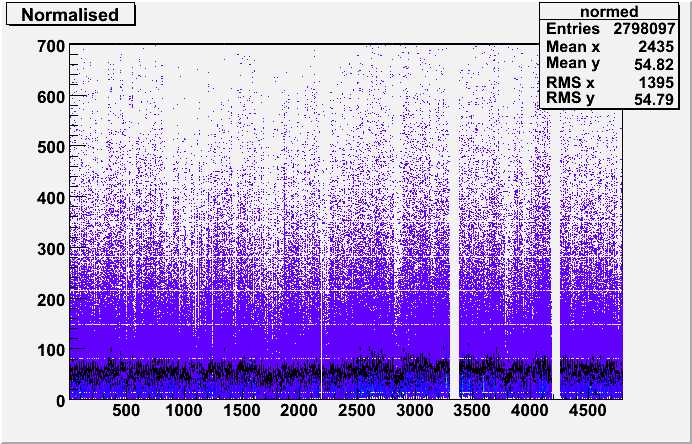
The next step was to normalise the slopes in constant theta to the gains across rings in eta
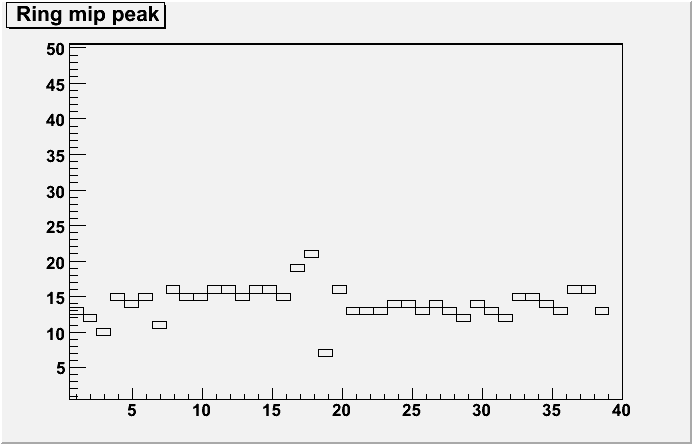
First, for all 40 rings, the normalised ADC values were combined
Rings run West to East: 1-20 and 20-40, 1=eta-1, 19/20 eta=0, 40 eta+1
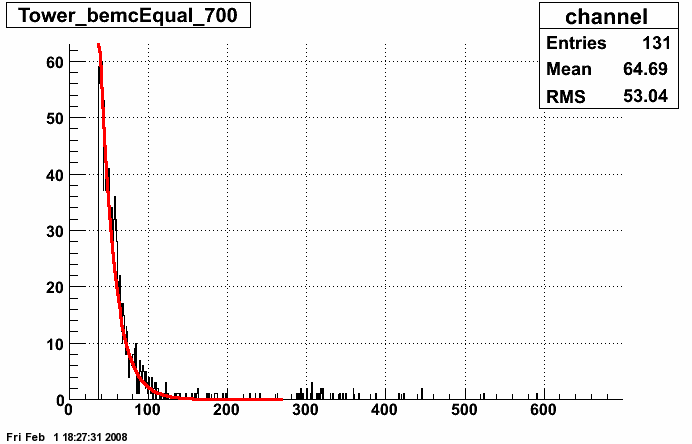
In this example you can see an attempt to fit the peak with a Gaussian and the expontial tail. In the end, I chose to fit the tail, the sample should be rich in electrons and the MIP fit was proving problematic
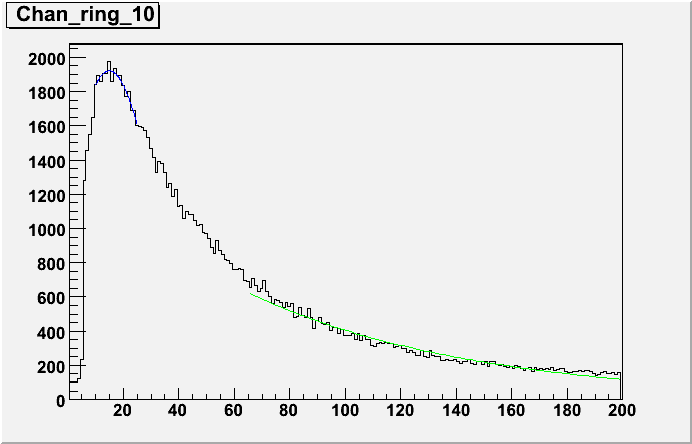
The maximum bin as a location for the MIP
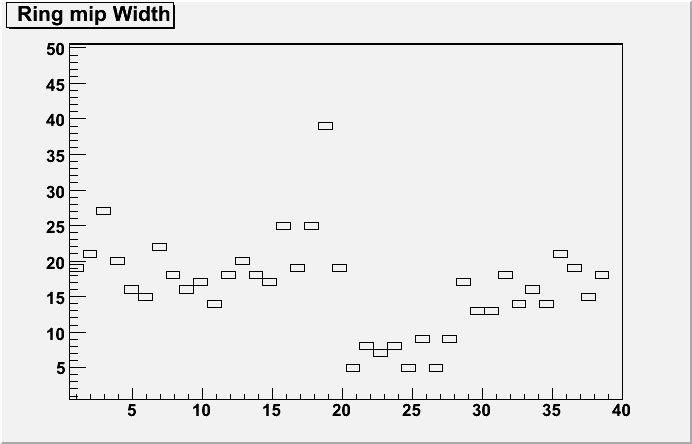
The width of a Gaussian within a MIP range of 5-30 ADC
The exp. slope per ring on the right hand side
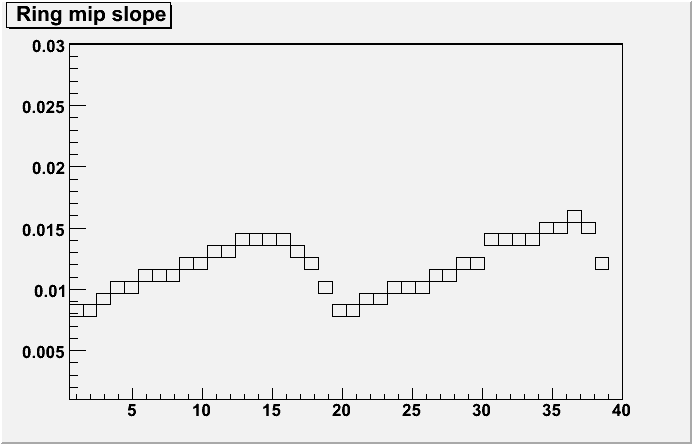
These slopes can then be used to re-calibrate the MIP peaks in theta to the ring. I picked an average ring, in this case ring 10, and calculated the gains that would be needed to equalise the other rings to this one (See above for example of ring 10)

These gains were for each ring were then applied to each normalised channel in Theta to perform the relative ring callibration
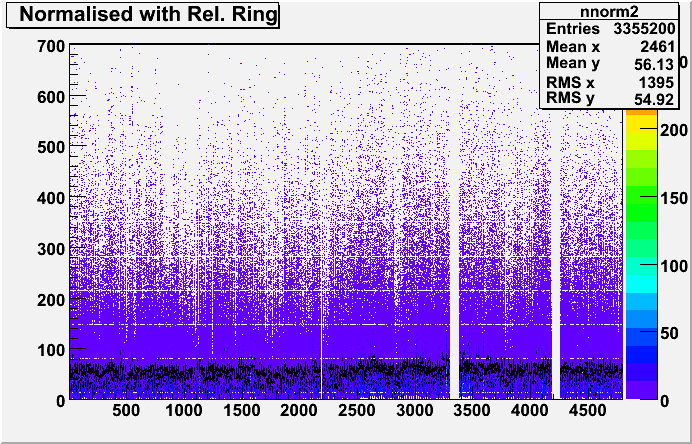
Sample plots from a few channels
In conclusion, the effect was not dramatic and this may be due to the statistics or the exponential fitting, a MIP peak calibration could also be tried but the low statistics per channel makes the position hard to find
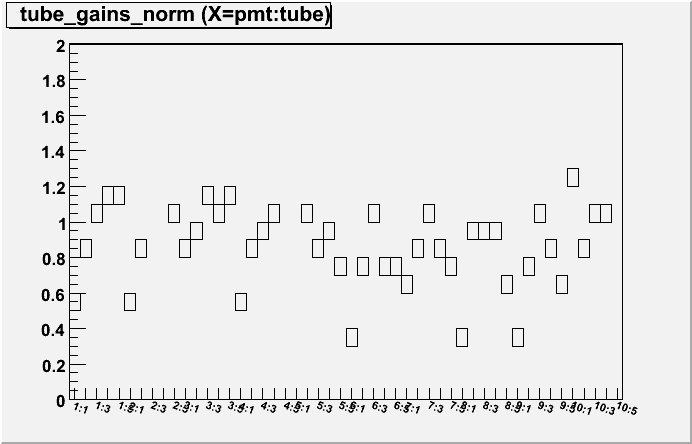
The next step was to analyse the tube gains with the corrected samples
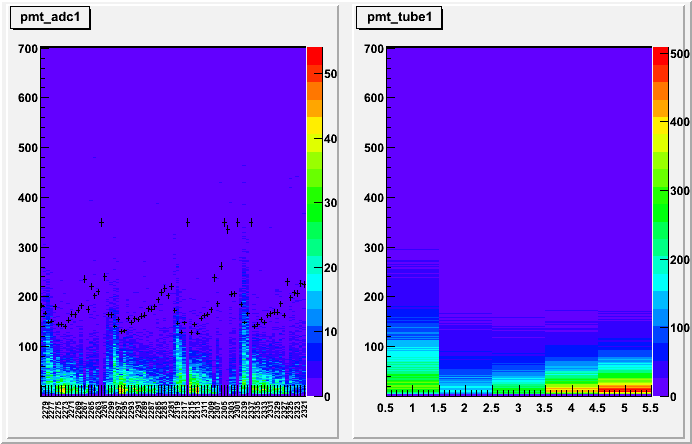
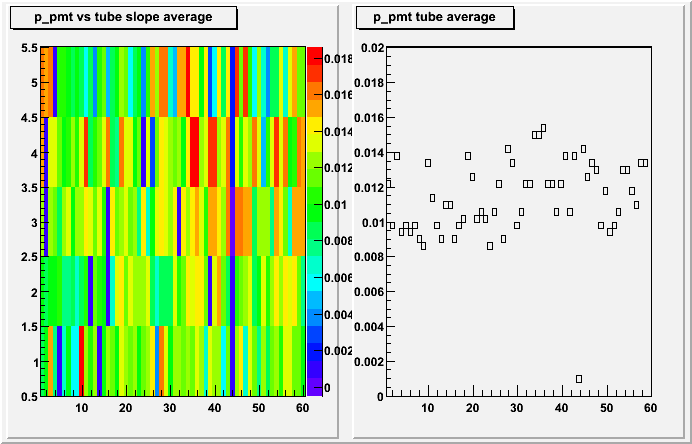
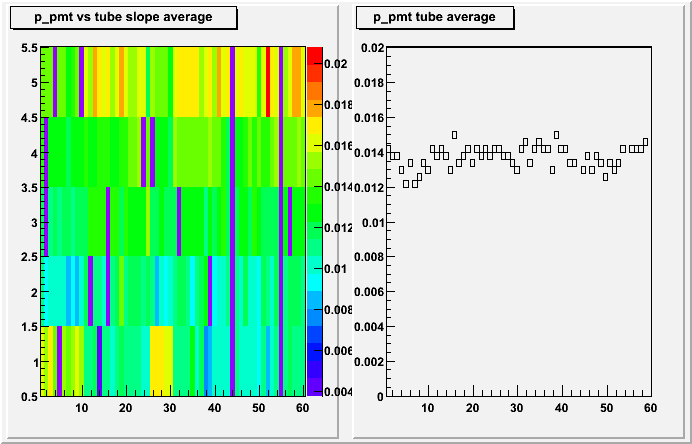
The tubes ADC values are grouped together and a fit is made
The right hand side shows the slope per PMT box, the left side for the tubes
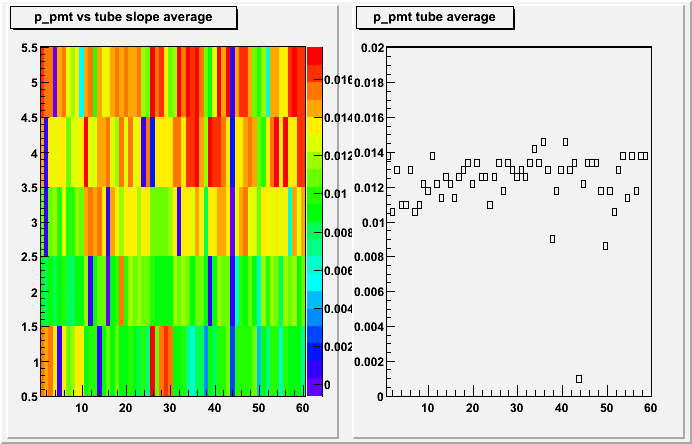
In conclusion, the ring calibration seem to make the results worse than with the normalisation, the method I am using seems to knock the calibration back out
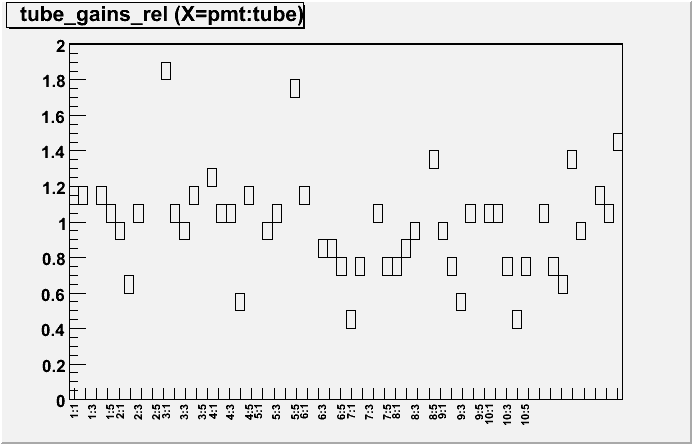
I tried a method to get an overall gain for a tube. By taking slopes from the raw, uncorrected data, for clusters of tubes and comparing them to the slopes from the clusters after they are normalised, this should give an indication of how far the tubes gains have drifted.
Gain= Slope(ADC uncorrected tube cluster)/Slope(ADC corrected tube cluster)
These plots show 10 PMT boxes per plots, with tubes 1-5