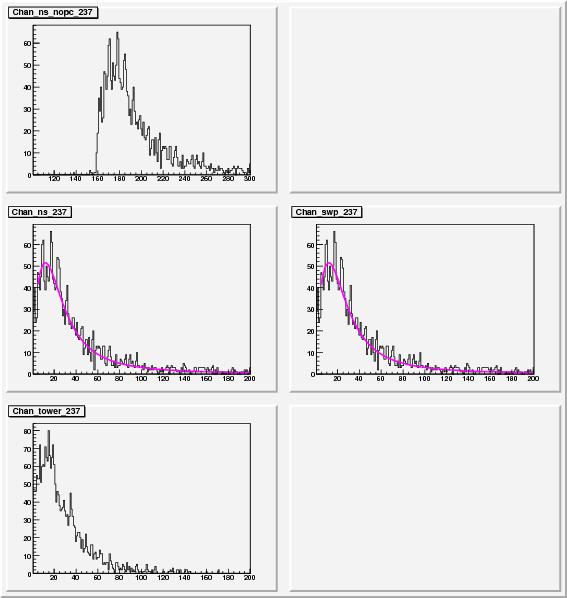
To get some idea of the gains and to try to change the voltages to the preshower I have made some comparisons of the Mip position and an exponential fit above 40 ADC units as an attempt to fit the slop
This was done with a Landau distribution
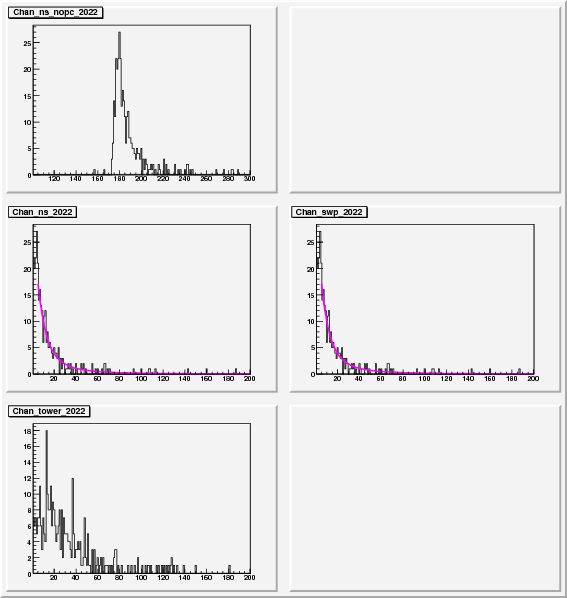
The Landau fit performed better if it peaked more then about 5 adc units from the X axis, otherwise the peak would drift to zero but the "Width" would seem to be OK
A good Landau fit
A fit that drifted to zero mean but still has a useful width
Link to all plots with Landau fits
There were a number of conditions:
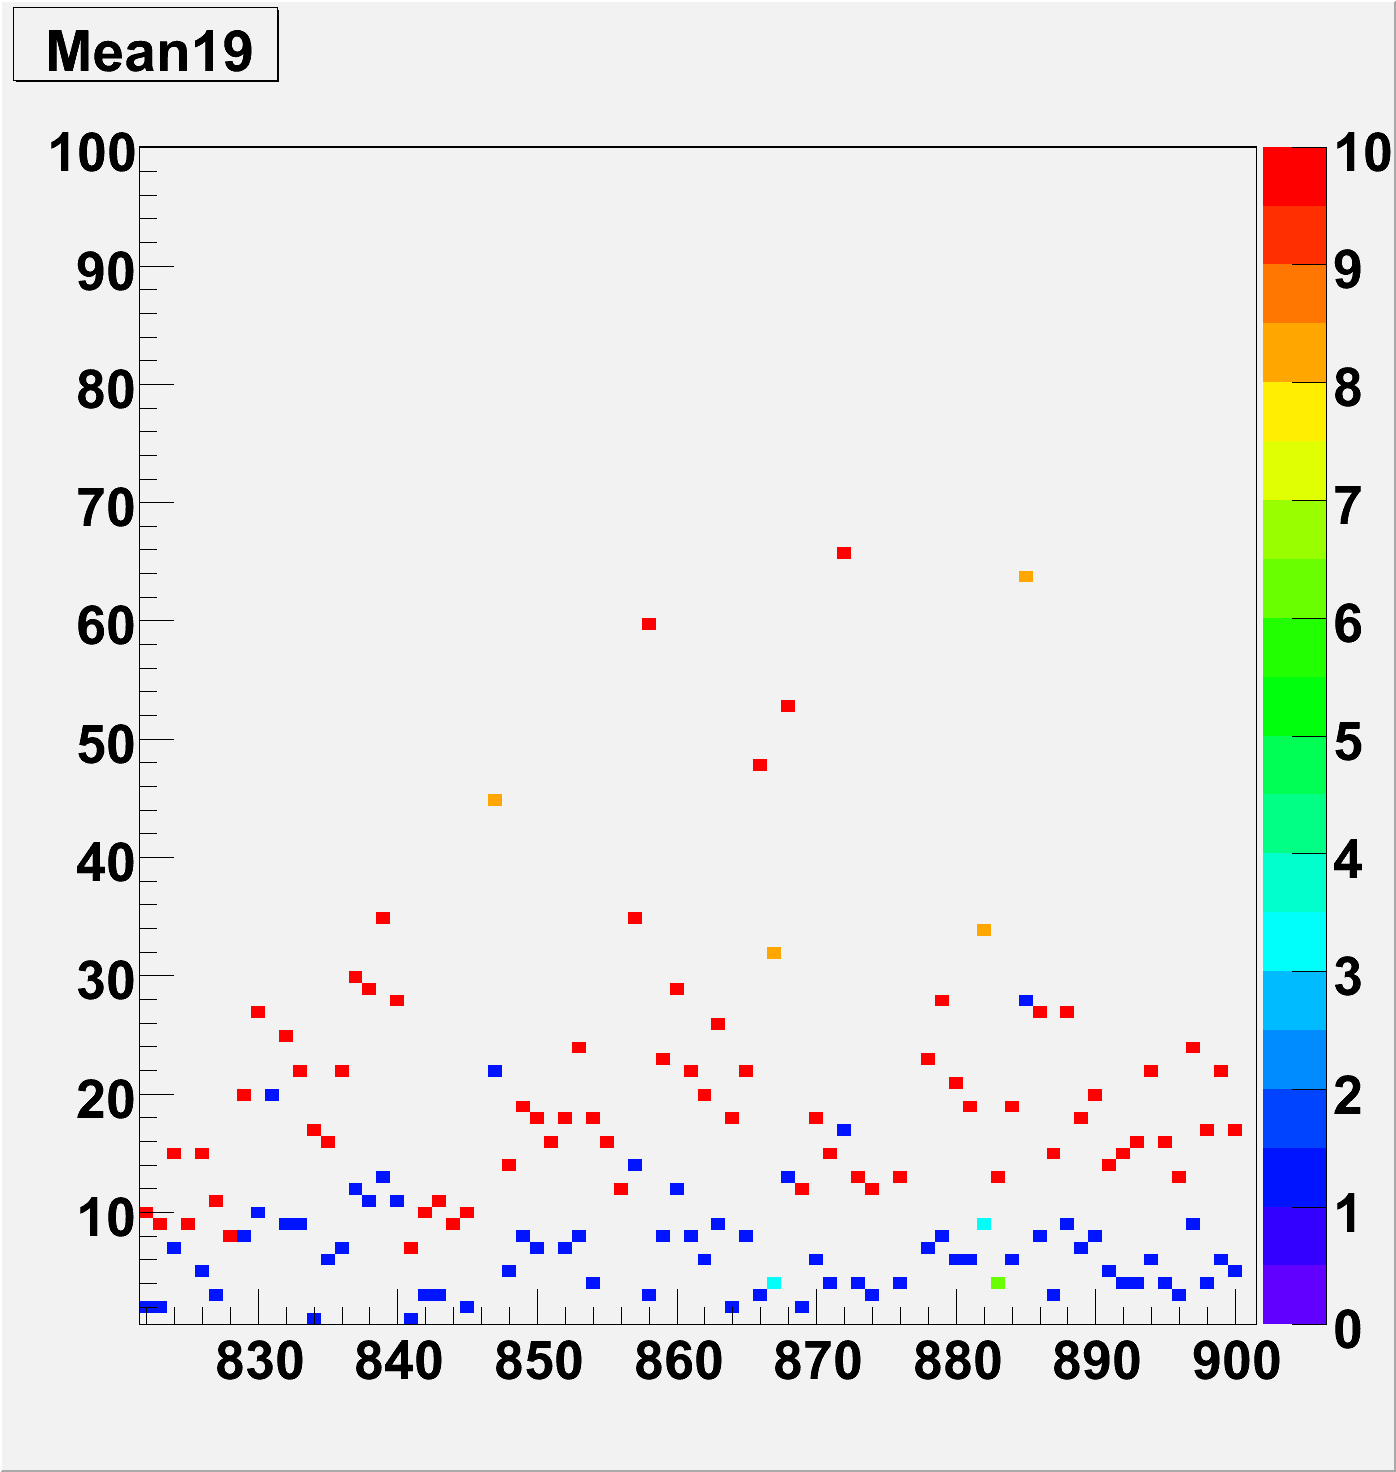
For each soft ID in these plots there are two points, the MIP mean and (Mip mean + RMS*3). This gives an idea of how the mean and width drift and if they are correlated
Colour Key
For each soft ID in these plots there is only one points, the RMS from above. This is to get an idea of how the Widths drift
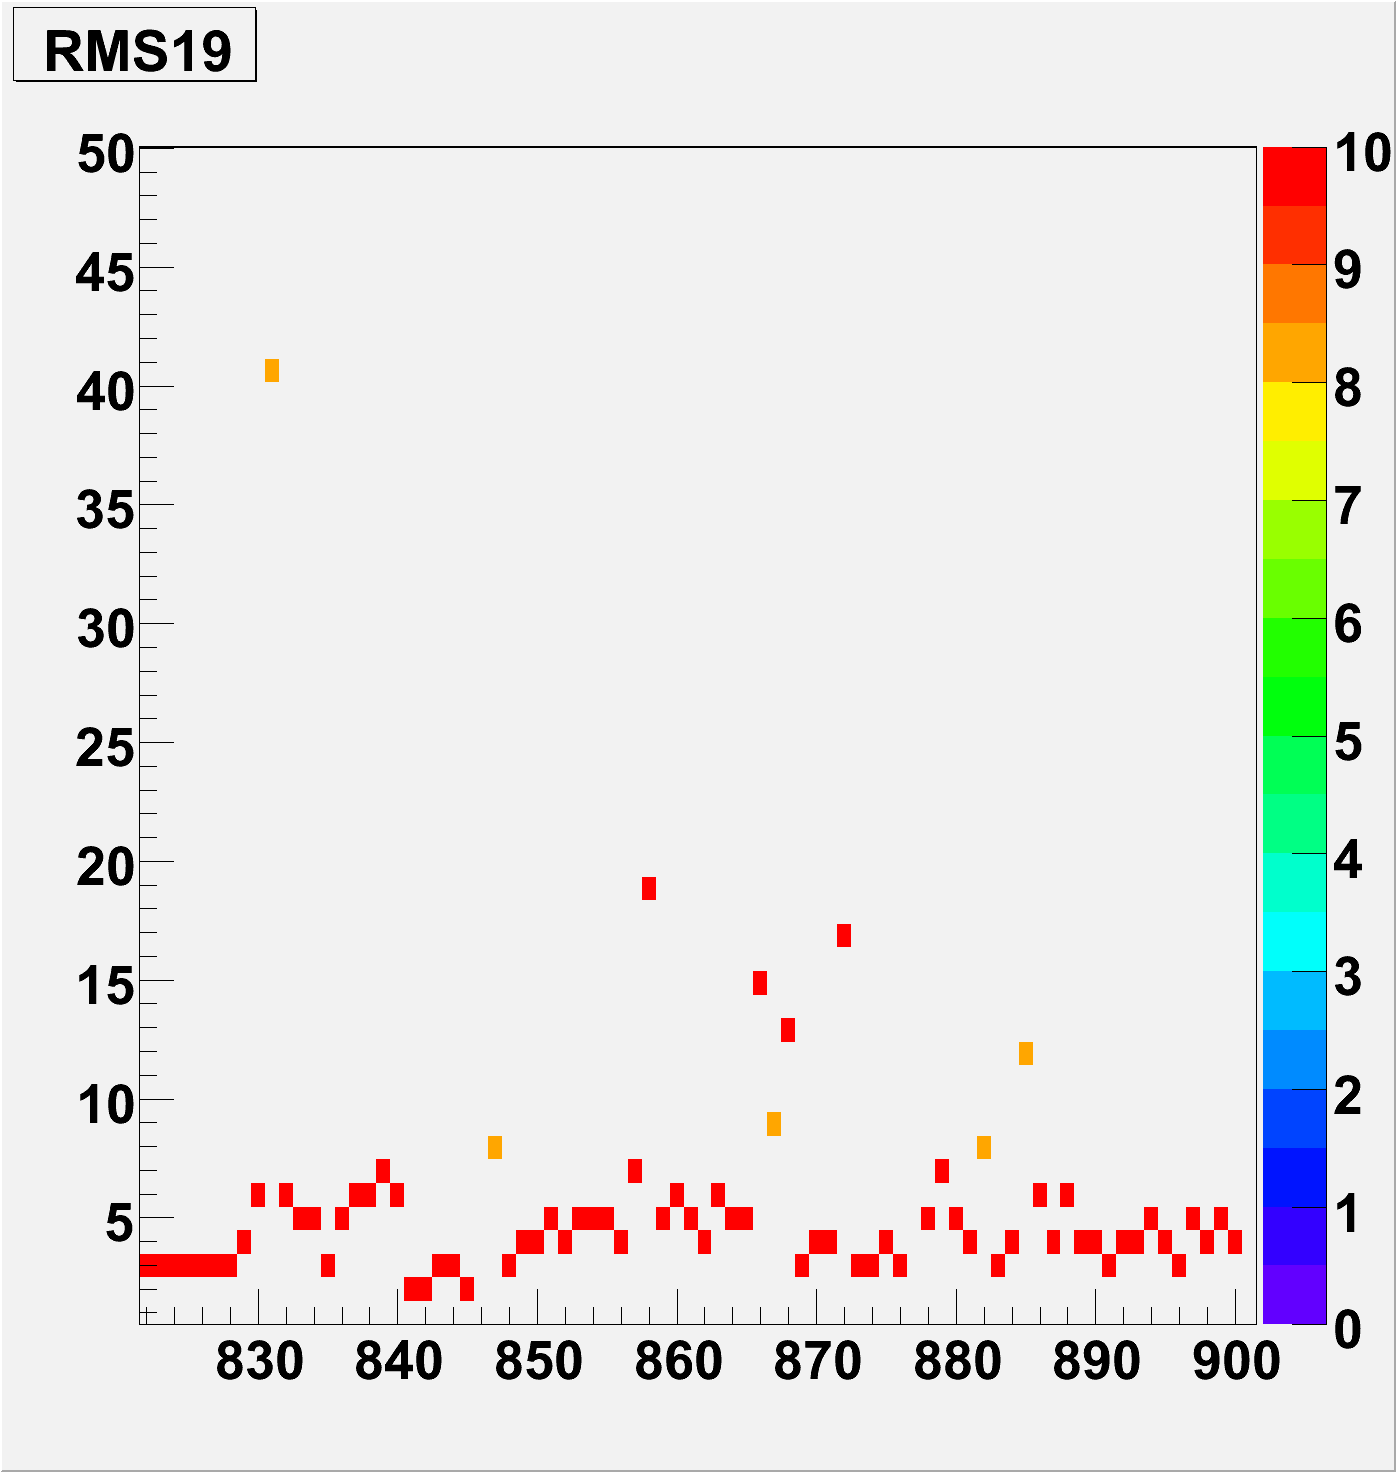
The Width of the MIP seems to be stable across this box, the drift is an effect of the MIP peak shifting
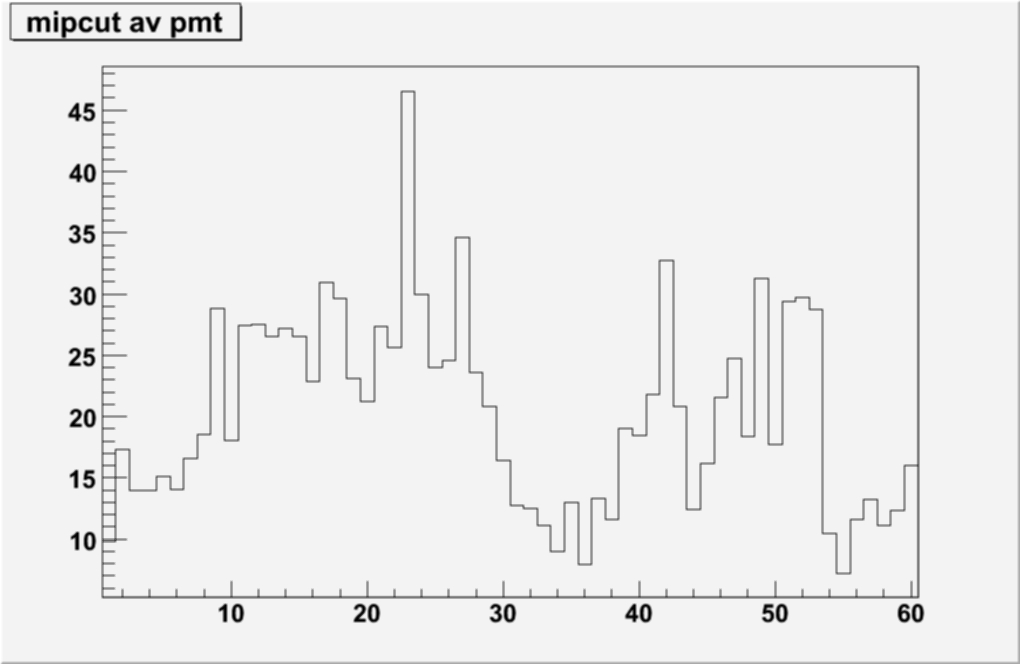
Summery plots were made, averaged for each PMT box for quick reference
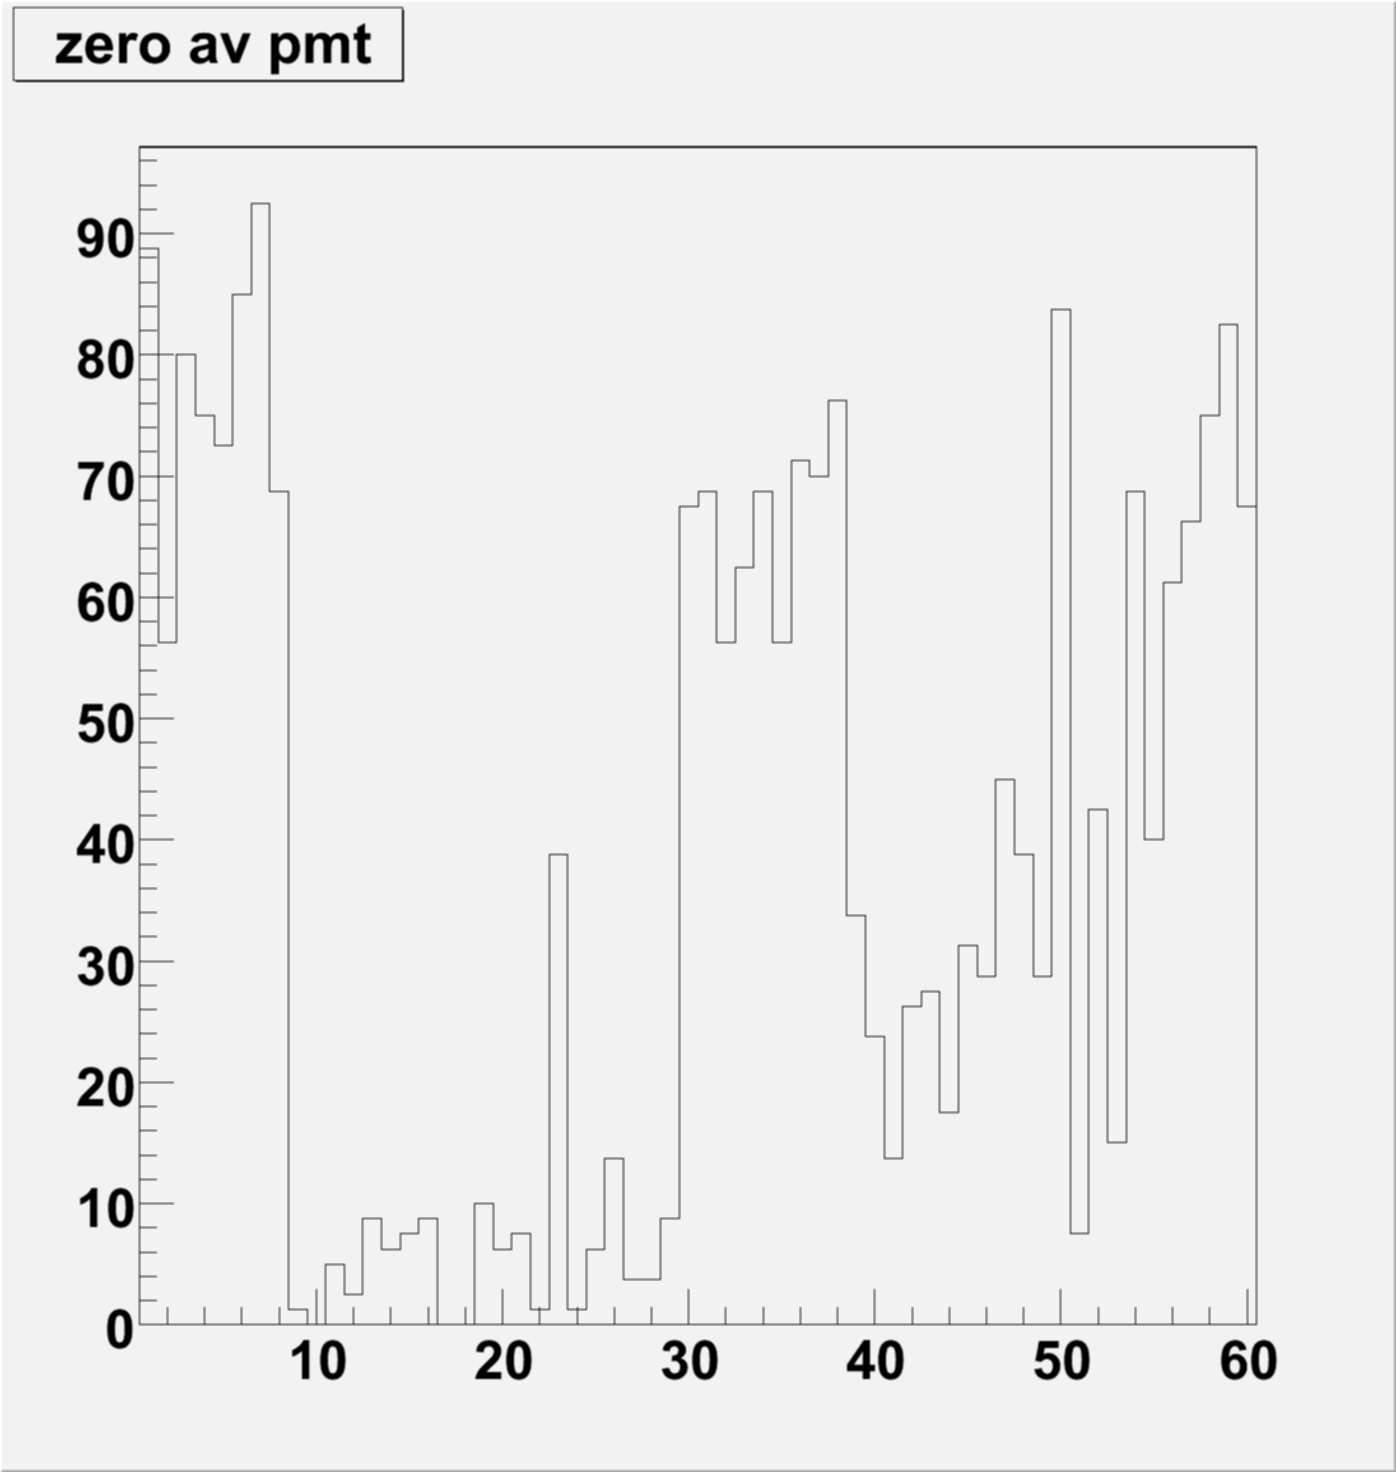
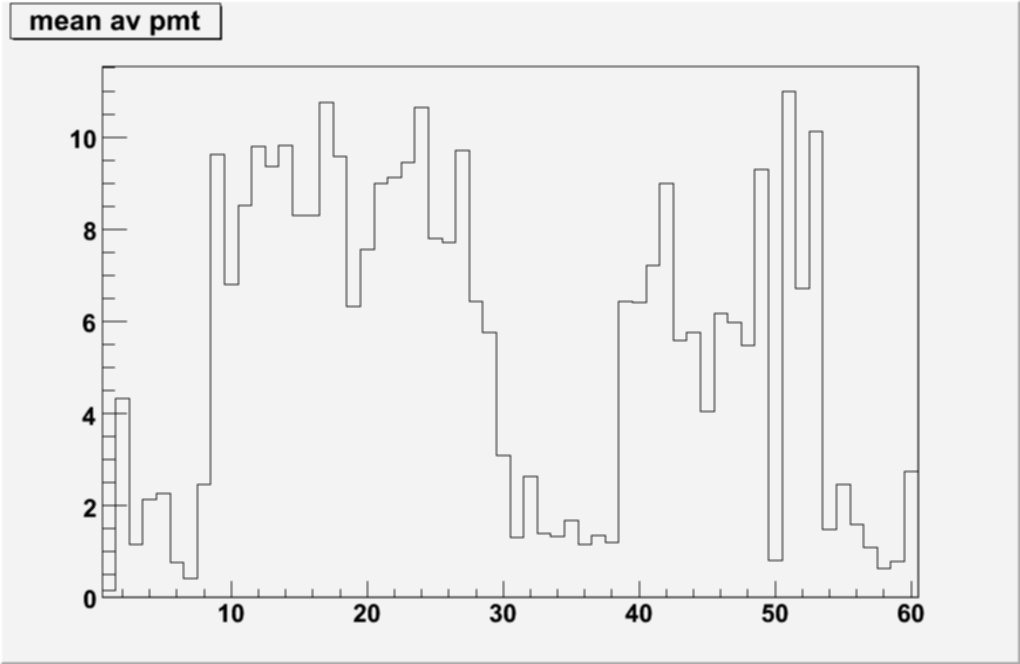
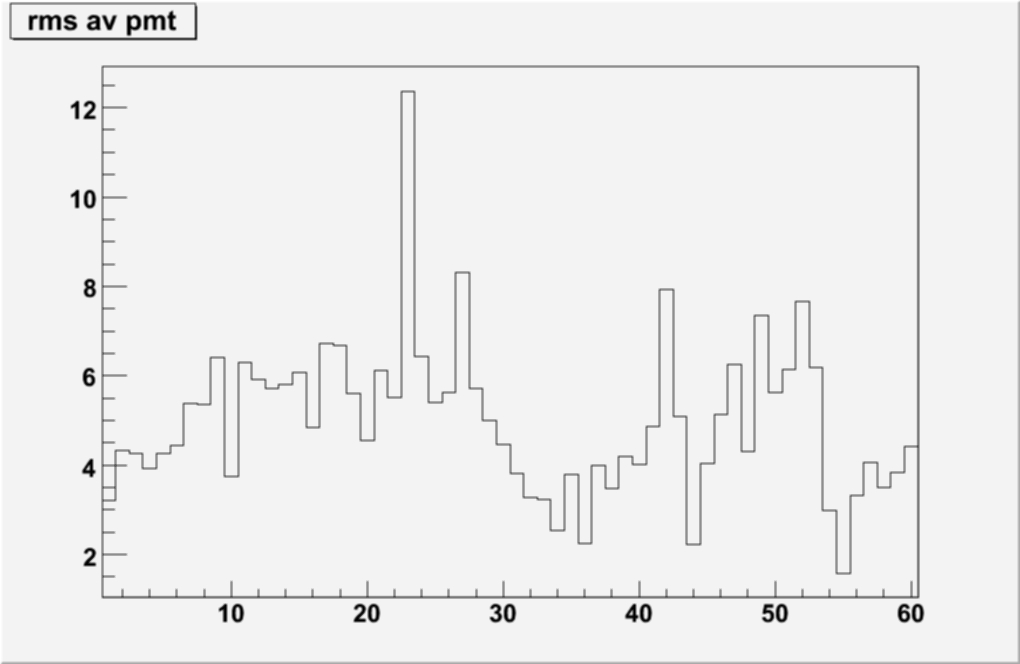
The RMS seems stable, also the Mean plot seems to suggest that there are sections where the gain is high and low over the 60 PMT boxes
These average values per box can be found here:
Format:Values from Summary Plots text file
Files meanXXX.png are mean+ rms, slopeXXX.png are rms and sXXX.jpg are summary
Tar file of PMT plots and Summary plots