Slope fitting with MIP subtracted
Here an exponential fit was made at 40 ADC units above pedestal. In this region onwards there should be no MIP signal
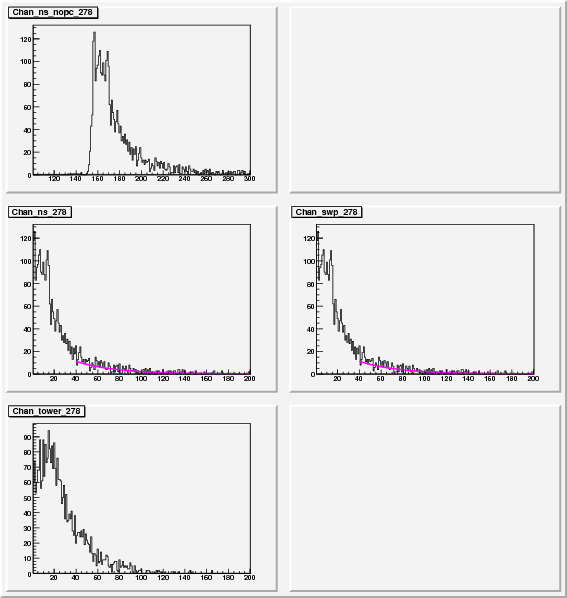
A typical fit in this region, note: only fitting after 40 Units (ped subtracted)
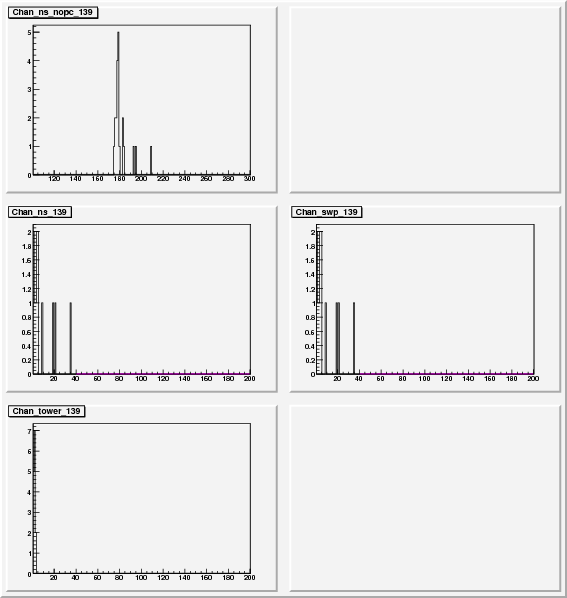
A bad fit. Limits here give a slope=1 then terminated
Link to plots with MIP subtracted slope fits
Link to these file in .tar.gz
PMT Slopes and shift from these fits
There were a number of conditions:
- PMT 1-30 West, 31-60 East
- Everything now with Swaps
- fitting: e(-[0]*x+[1])
- [0]=slope, [1]=shift from here on
- Only one colour used now
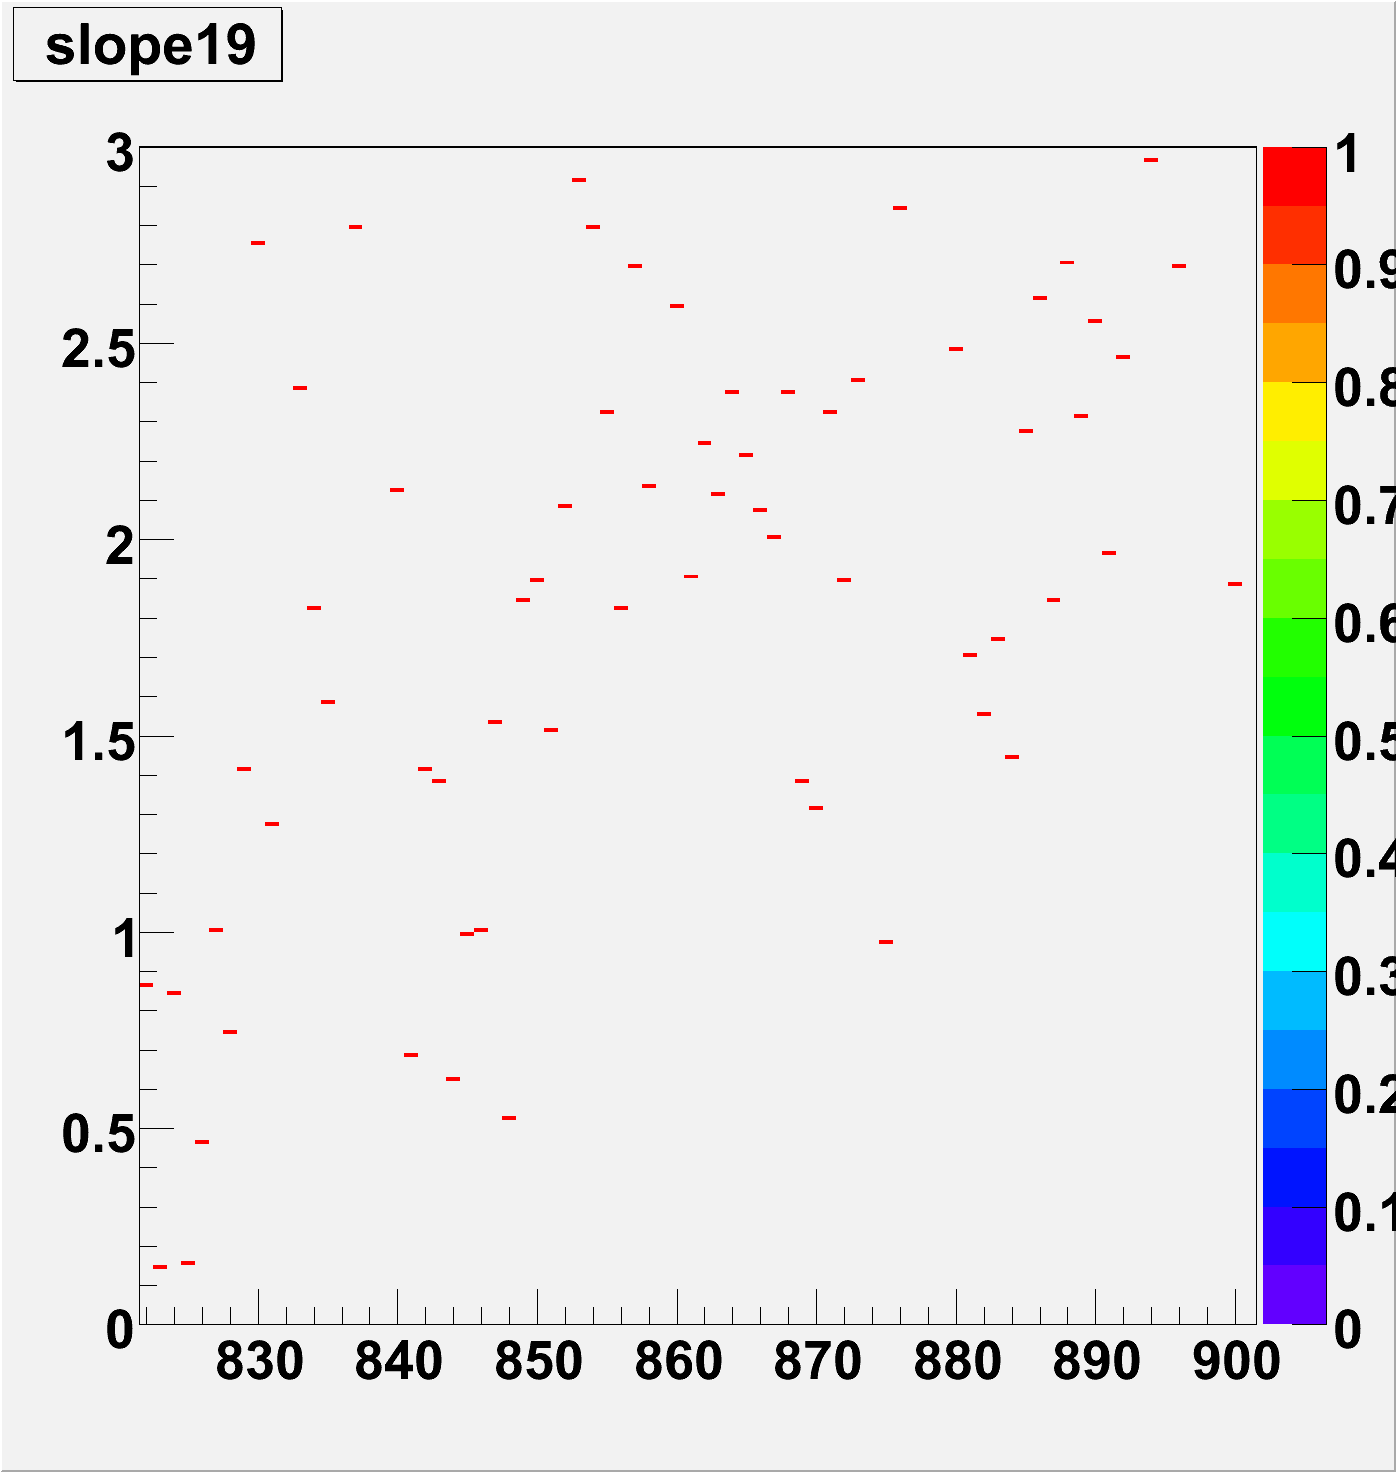
Slope [0]
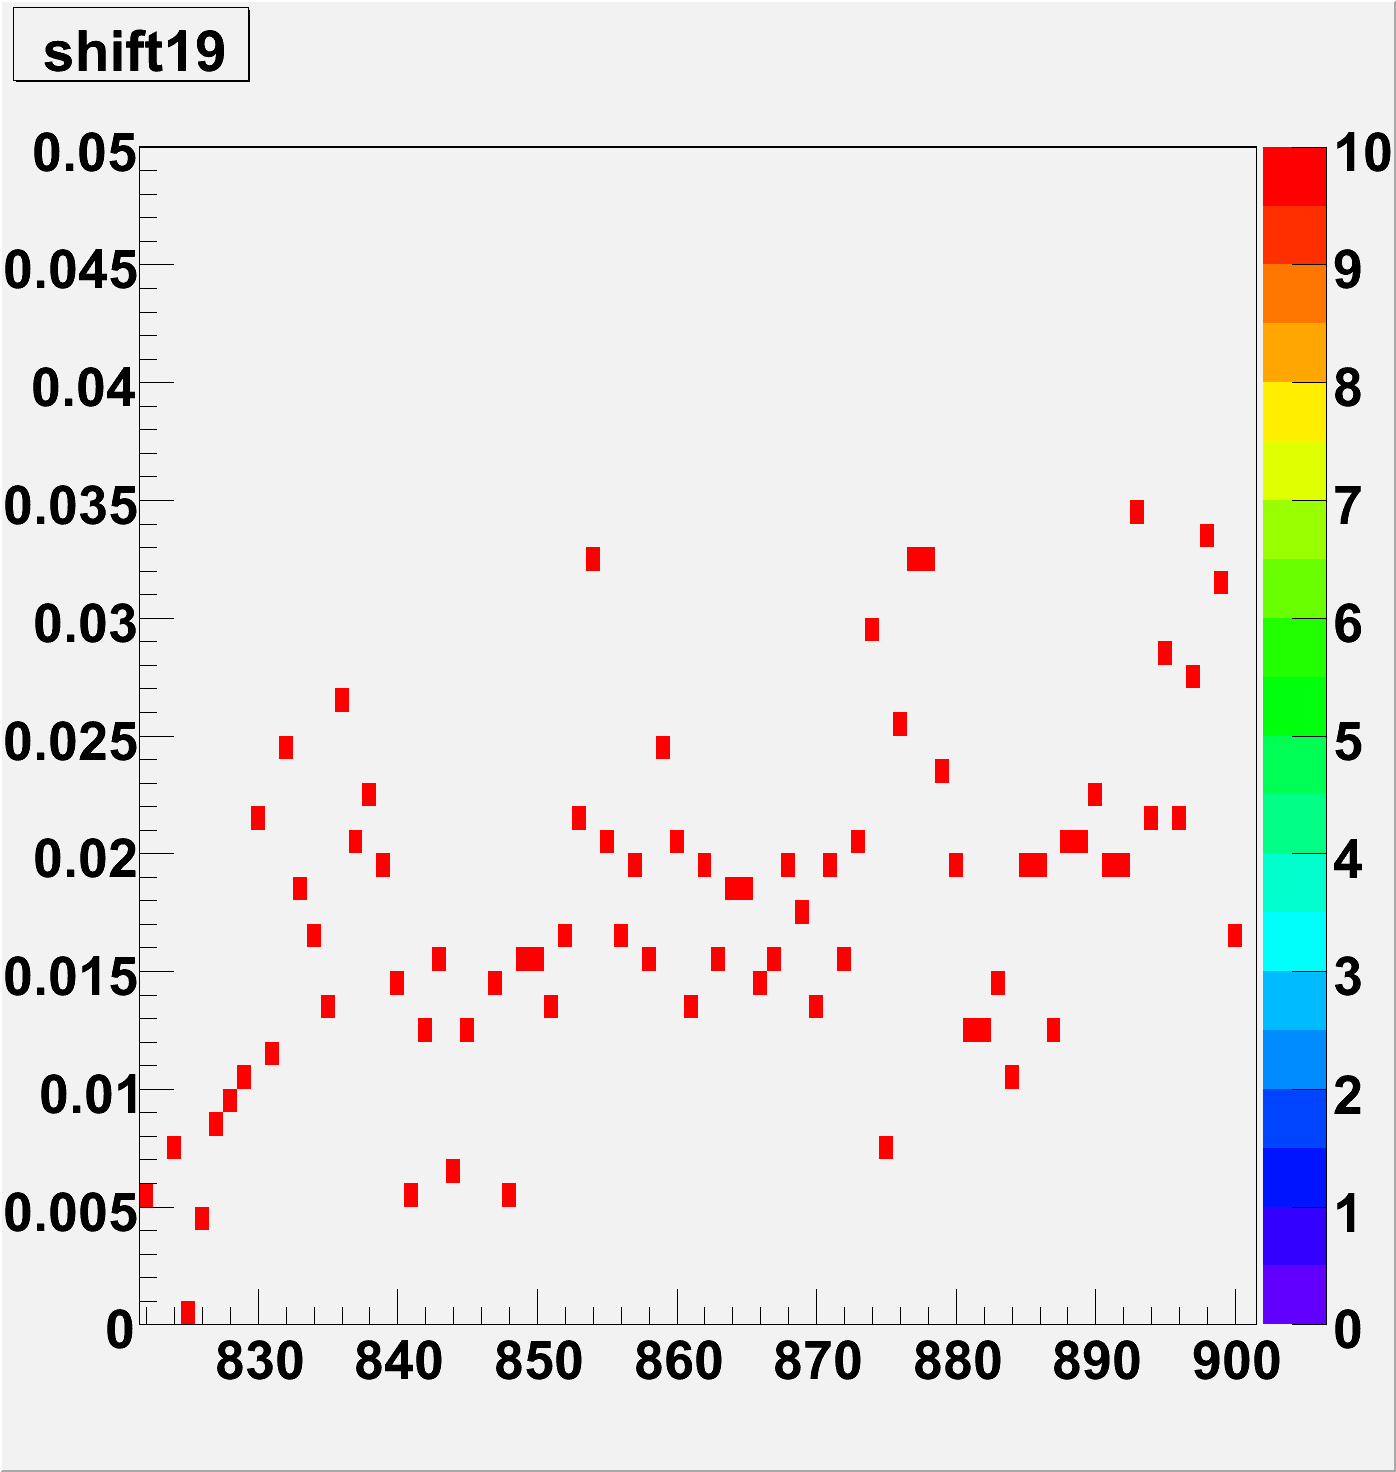
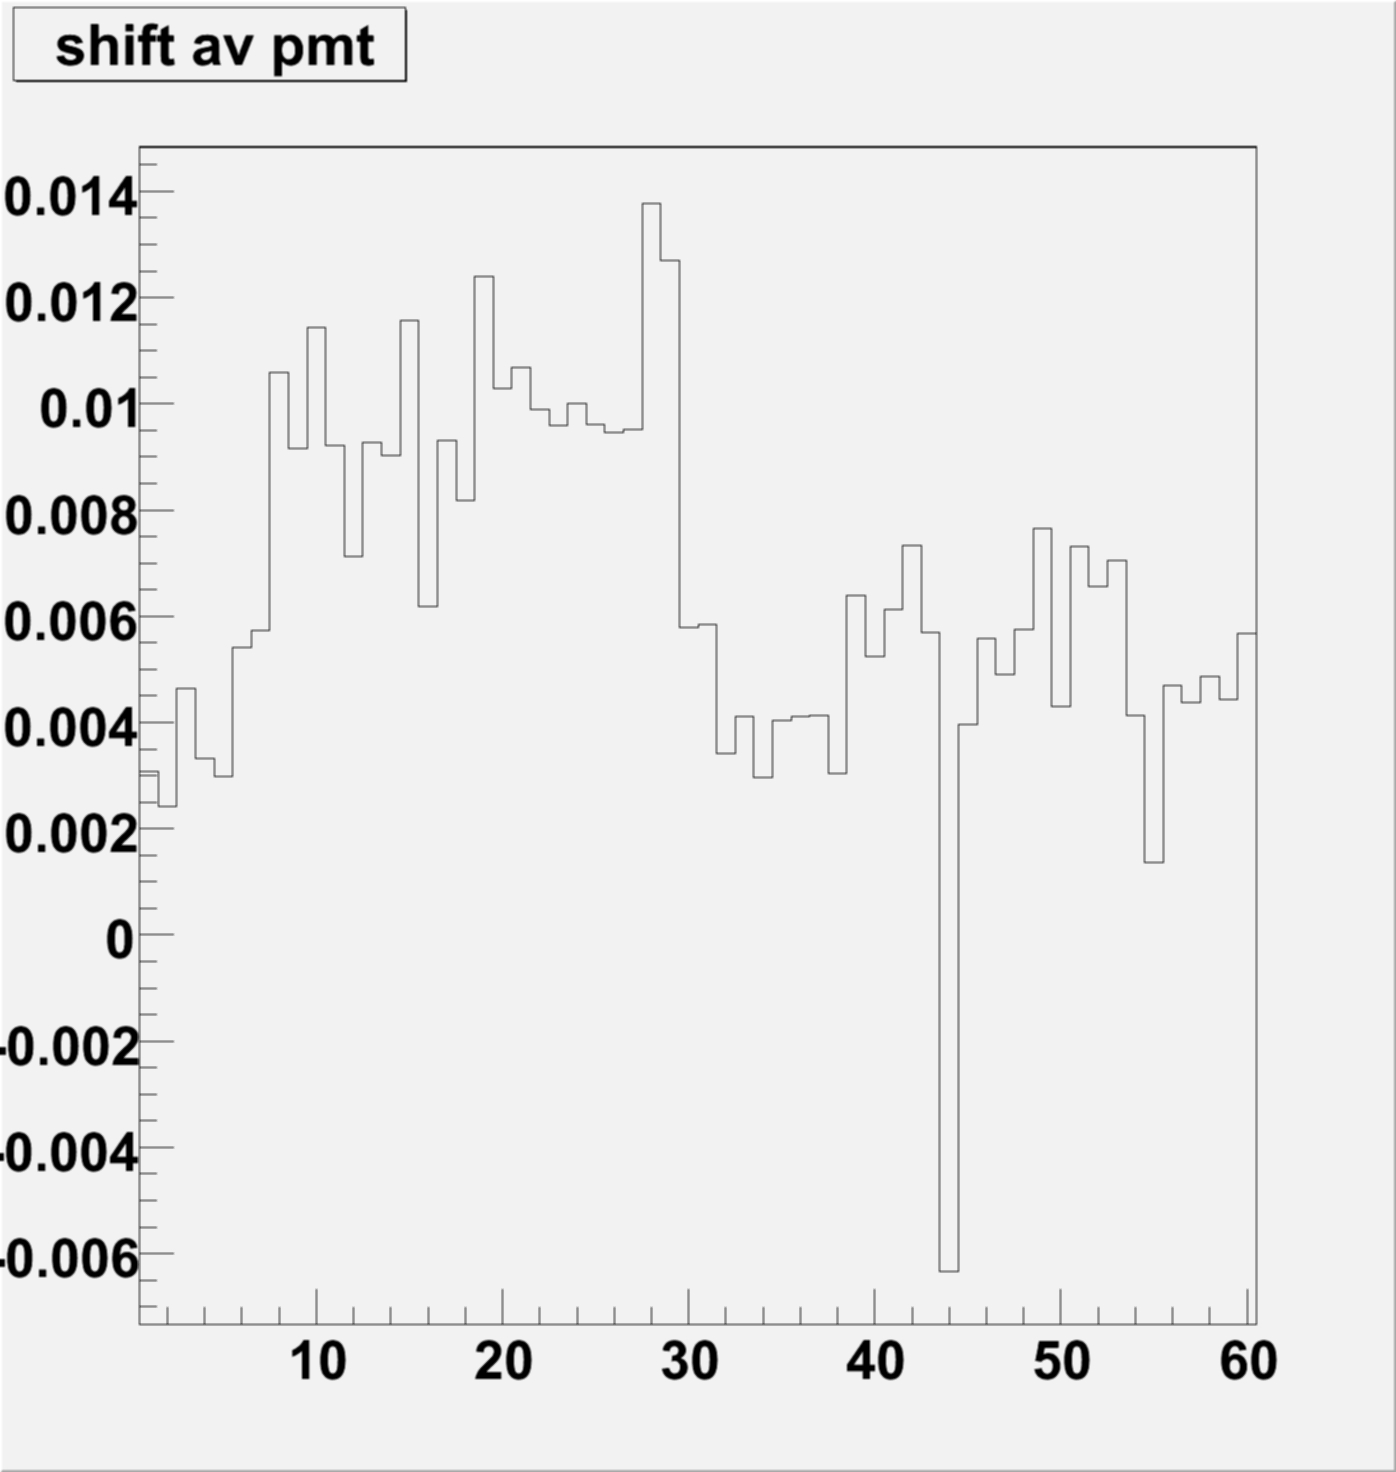
Shift of function [1] (not so interesting)
Summery plots were made and averaged for each PMT box for quick reference
% of slope == 1, i.e, fit that fails with zero entries after 40 adc, per PMT box
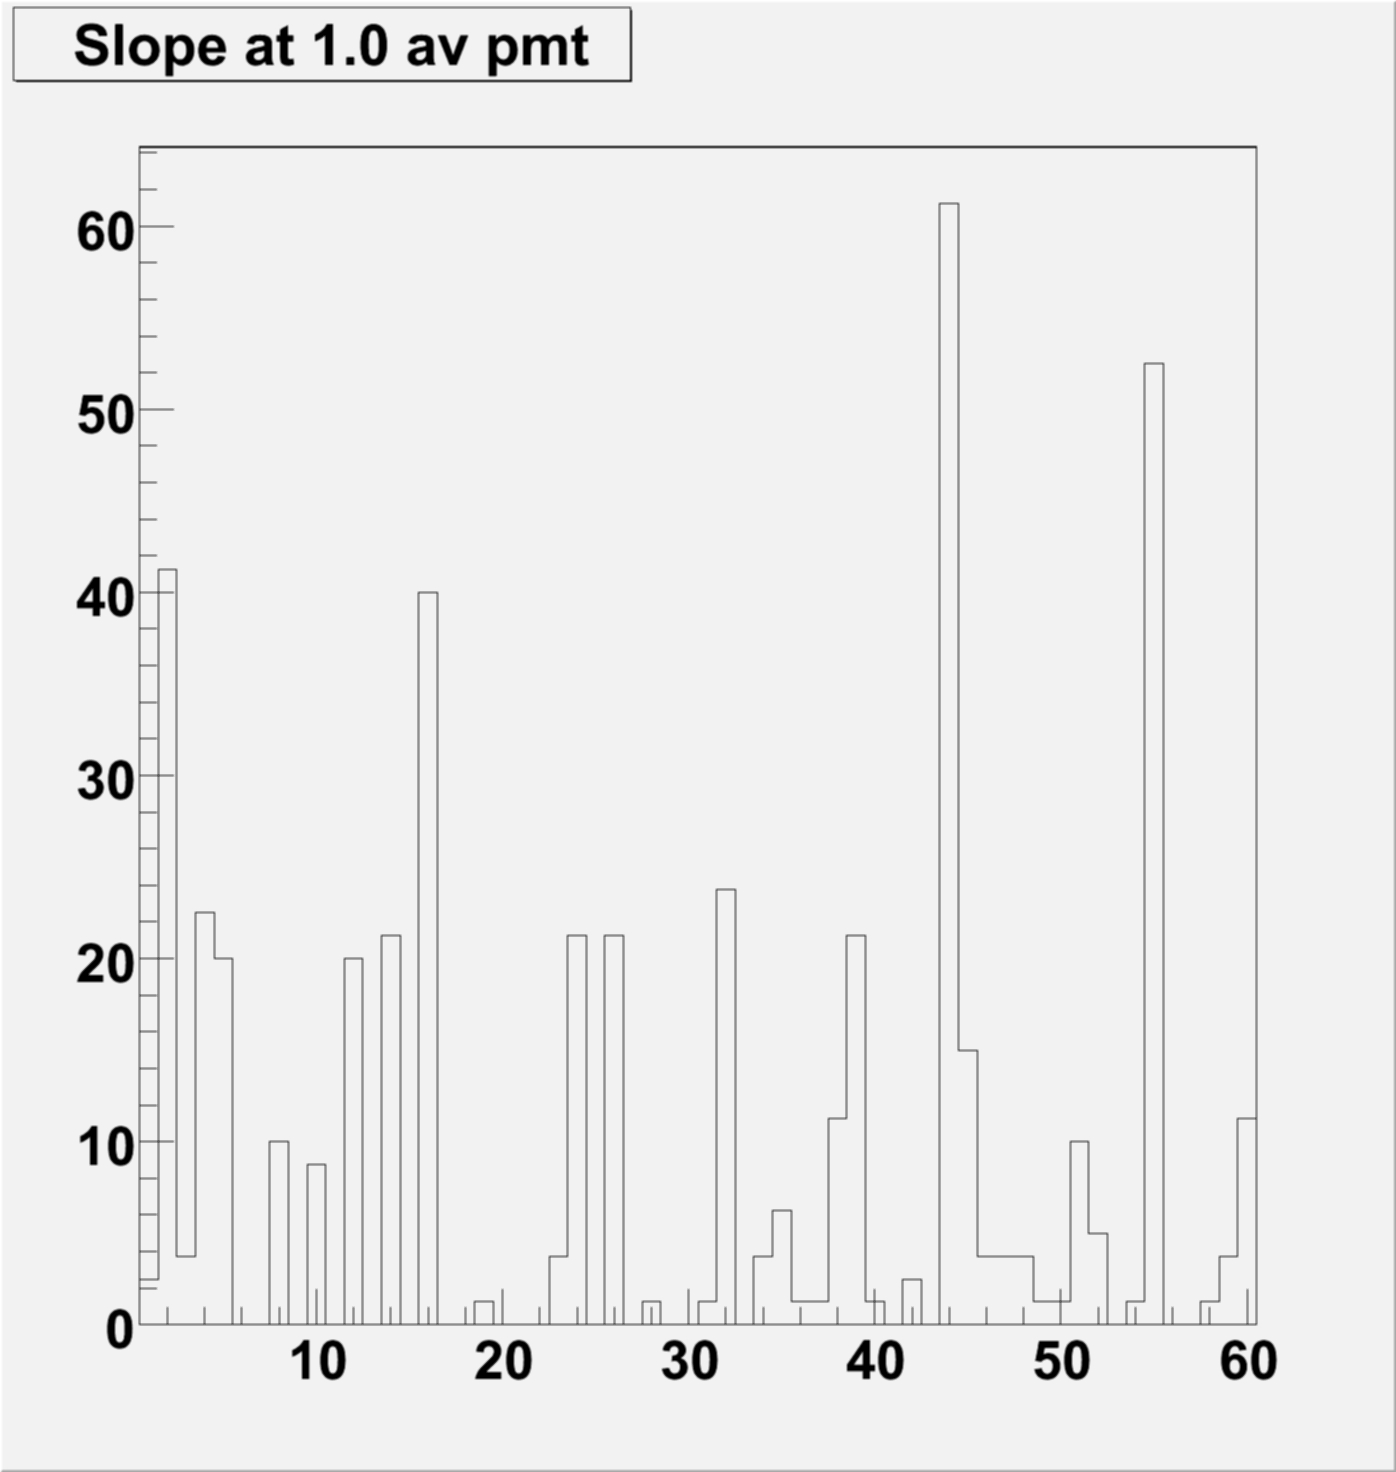
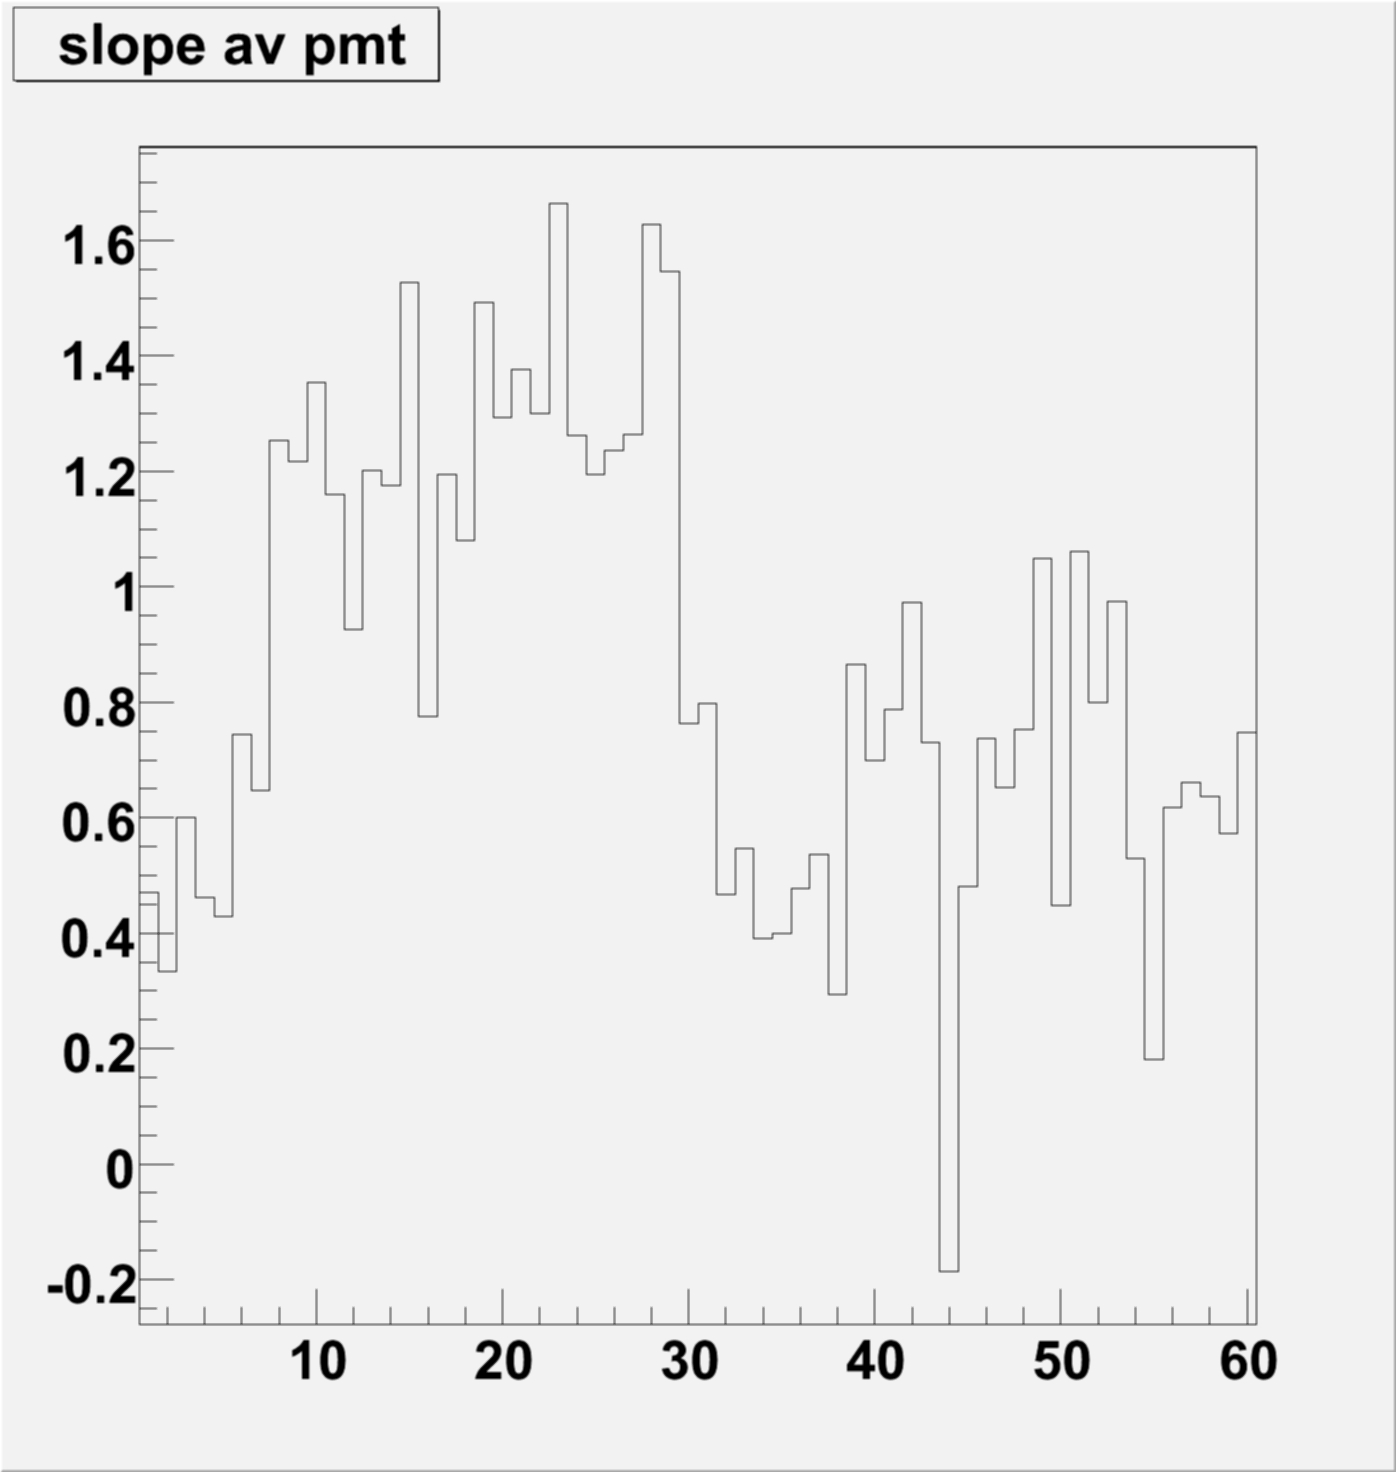
Average of slope per box (Interesting see conclusion)
Average of shift per box
These average values per box for the slopes can be found here:
Format:
- PMT box
- % of bad fits (==1)
- Slope
- Shift
- Dummy, ignore
Values from Summary Plots text file
PMT Plot files from this section
Files meanXXX.png are mean+ rms, slopeXXX.png are rms and sXXX.jpg are summary
Link to all plots
Tar file of PMT plots and Summary plots
Conclusion overall
- The averaged Mean MIP position plot (page 1) and the Average Slope position from here seem to have very similar structures
- In both cases PMT boxes between 9-29 and 39-52/4 seem better
- Boxes in between these ranges are the best candidates to change gains
- Finally, there is a lot of information here and in root files, if you would like something specific please let me know and I will put it together for you. Data from the fits is grouped at three levels: Average per PMT, PMT and then Soft ID
-
Go to page 1 for MIP fits